Download
1 / 13
140 likes | 275 Vues
The Ocean Observatories Initiative aims to study the onset of spring blooms in the Irminger Sea, exploring the influence of photoperiod on diatoms and ecosystem responses to climate change in high latitudes. Join us to unravel this environmental mystery!

E N D
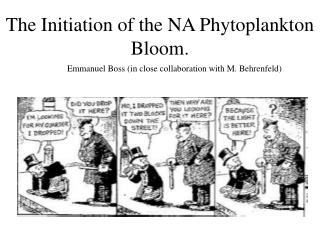
The Ocean Observatories Initiative (OOI) will construct a networked infrastructure of science-driven sensor systems to measure the physical, chemical, geological and biological variables in the ocean and seafloor. Greater knowledge of these variables is vital for improved detection and forecasting of environmental changes and their effects on biodiversity, coastal ecosystems and climate. Sampling the Onset of the Spring Bloom in the Irminger Sea Raffaele Ferrari Massachusetts Institute of Technology We have new evidence that spring blooms are triggered by photoperiod at high latitudes. To confirm this hypothesis we need to sample Irminger Sea waters for diatoms before and after the bloom onset. If the photoperiod theory was confirmed it would change our understanding of the response of ecosystems to climate change at high latitudes.
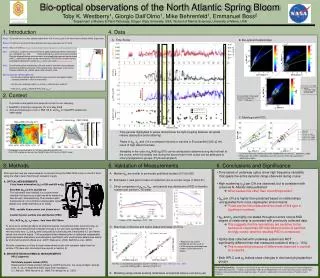
Phytoplankton Blooms • Phytoplankton account for half of the global primary production (Longhurstet al. 1995) • Spring phytoplankton blooms at high latitudes contribute a large fraction of that production driving ocean carbon uptake and supporting fisheries
Theory of Bloom OnsetSverdrup, 1953 where In winter • Bloom can start if • light increases • grazing pressure decreases • air-sea fluxes decrease • ML shoals At bloom onset
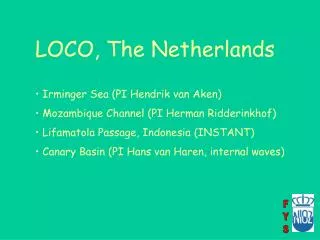
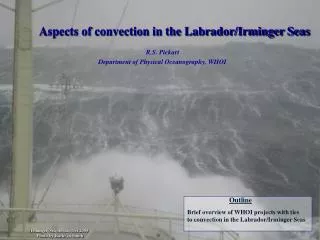
Sampling blooms with BioArgonorth of 60N • Bio-Argo floats: • profiles of T, S, p, fluorescence and PAR every 10 days Bio-Argo floats AlexandreMignot
Bloom onset north of 60N Heat fluxes and MLD at bloom onset Day length at bloom onset
Photoperiod Hypothesis for Diatom Blooms Germination when photoperiod is 9 hours Bloom Decay Spring Bloom Resting Stage
Photoperiod Hypothesis for Diatom Blooms • Photoperiod is equal to day length when buoyancy losses are weak (< 200 W/m2) • Photoperiod is shorter than day length when buoyancy losses are strong (> 200 W/m2)
Testing the photoperiod hypothesis within OOI Key measurements provided by OOI Surface heat and freshwater fluxes Profiles of temperature and salinity in the surface mixed layer Multi-year glider profiles of T, S, p and fluorescence Complementary measurements Sampling waters when the day length is shorter than 9 hours (November to February) Equip gliders with PAR, nutrients, and oxygen sensors Participate in some of the cruises to sample phytoplankton and grazers
Acknowledgments References Bio Argo teams lead by Herve’ Claustre (LOV, France) and Kjell Arne Mork (IMR, Norway) Taylor, J., and R. Ferrari, 2011: The role of density fronts in the onset of phytoplankton blooms, Geophys. Res. Lett., 38, L23601. Taylor, J., and R. Ferrari, 2011: A shutdown of turbulent convection can trigger the spring phytoplankton bloom, L & O, 56, 2293-2307. Ferrari, R.,S. Merrifield and J. Taylor, 2013: Predicting the onset of North Atlantic phytoplankton blooms, J. Marine Systems, under review. A. Mignot, R. Ferrari, and H. Claustre, 2013: Daylength and the onset of North Atlantic blooms in Northern Supolar Gyres, to be sumbitted.
Recipe for Phytoplankton Blooms Algal Growth Cycle phytoplankton+ light + nutrients + CO2 = growth + O2
Restratification Hypothesis(Sverdrup, 1953) Surface cooling • In winter, surface cooling leads to convection and mixed layers deeper than a critical depth • In spring, the mixed layers become shallower than a critical depth • Bloom starts when H=Hc Critical depth Mixed layer depth Mixed layer depth Critical depth
Heat Flux Hypothesis(Taylor & Ferrari, 2011) Surface cooling (Q<0) • In winter, surface cooling (Q<0) leads to convection and deep mixed layers • strong turbulence keeps phytoplankton away from the sunlit layers • In late winter, surface cooling stops (Q≥0) before the mixed layers shoal • turbulence subsides and phytoplankton can grow in the sunlit layers • Bloom starts when Q=0 Mixed layer depth Surface warming (Q≥0) Mixed layer depth
Dilution Hypothesis(Behrenfeld, 2010) Surface cooling Strong grazing (Z large) • In late fall, mixed layer are still shallow because cooling has just started • grazing prevents is strong and phytoplankton cannot grow • In early winter, mixed layers deepen • grazing pressure goes down, because grazers are diluted, and phytoplankton starts growing • Bloom starts when Grazing rate < Growth rate Mixed layer depth Surface cooling Mixed layer depth