Download
1 / 1
10 likes | 95 Vues
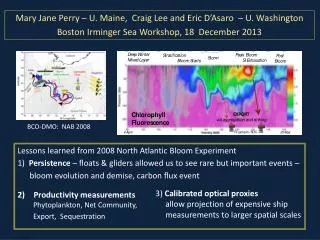
Annual Climatology (1997-2008). May 2008 Chl (mg m -3 ). 45. 450. 0.007. NAB data “best fit” Loisel et al. (2001) Stramski et al. (1999) Stramski et al. (2008) Gardner et al. (2006). POC ( m M). POC ( m M). ~NAB site.

E N D
Annual Climatology (1997-2008) May 2008 Chl (mg m-3) 45 450 0.007 NAB data “best fit” Loisel et al. (2001) Stramski et al. (1999) Stramski et al. (2008) Gardner et al. (2006) POC (mM) POC (mM) ~NAB site Chl (mg m-3) PAR (Ein m-2 d-1) MLD (m) bbp (m-1) bbp_526 (m-1) cp_526 (m-1) Fucoxanthin/Chl a 19’ Hex-Fuc /Chl a 0 0 0 cp 526 (m-1) bbp 526 (m-1) Chl a (mg m-3) Chl a (mg m-3) Npts % bias bbp 526 (m-1) Wavelength (nm) cp 526 (m-1) y=0.77 (±0.03) – 0.09 (±0.05) y=0.94 (±0.07) – 0.01 (±0.08) Chl-ACs (mg m-3) Chl-ACs (mg m-3) Chl-HPLC (mg m-3) Chl-Fluor (mg m-3) Bio-optical observations of the North Atlantic Spring Bloom Toby K. Westberry1, Giorgio Dall’Olmo1, Mike Behrenfeld1, Emmanuel Boss2 1Department of Botany & Plant Pathology, Oregon State University, USA, 2School of Marine Sciences, University of Maine, USA 1. Introduction 4. Data • What: Presented here are data collected aboard the R/V/ Knorr as part of the North Atlantic Bloom (NAB) Experiment • Where: A 10000 km2 area of the North Atlantic nominally centered on 61ºN, 26ºW • When: May 2-22 2008 (autonomous measurement platforms were deployed prior to and recovered after this time) • How: Continuous, underway measurements of spectral particulate beam attenuation • (cp), absorption (ap), and backscattering (bbp) were measured simultaneously. • Discrete biogeochemical measurements of phytoplankton pigment concentration • (HPLC), particulate organic matter concentration (POC/PON), and bio-volume • estimated phytoplankton carbon (Cphyto) were also made (but not presented here). • Why: Examine bio-optical relationships with one another and with relevant biogeo- • chemical quantities during one of the largest mass “greenings” in the ocean. • Provide validation for satellite observation at basin scale. • Specific questions being addressed: • Are the observed bio-optical relationships consistent with global models • and data collected in other environments? • Are the two scattering indices (cp and bbp) related to one-another? • How are cp and bbp related to POC and Cphyto? A. Time Series B. Bio-optical Relationships 0.70 0.56 0.42 Reykjavik cp(526) (m-1) bbp(526) (m-1) 0.28 0.14 Chl-ACs (mg m-3) 2D histograms (N>30000) “best fit” Loisel & Morel (1998) L & M (1998) w/ N.Atl Huot et al. (2008) 2. Context Diatoms ? ap(490)/ap(676) Prymnesiophytes ? Data collected in Equatorial Pacific for comparison (**NOT** NAB data) • To provide some spatial and temporal context for our sampling: • SeaWiFS L3 Monthly composite Chl a for May 2008 • Annual climatologies of Chl a, PAR, MLD, and bbp for SeaWiFS satellite era • (1997-2008) pigment ratio (mg m-3) C. Matchups with POC Month Day • Time periods highlighted in yellow demonstrate the tight coupling between all optical • indices (absorption and scattering) • Peaks in bbp, cp, and Chl a correspond directly to maxima in [Fucoxanthin]/[Chl a], the • result of high diatom biomass • Variability in the ratio of ap(490)/ap(676) can be attributed to diatoms during the first half of • the cruise, while the steady rise during the second half of the cruise can be attributed to • other phytoplankton groups (Prymnesiophytes?) * Climatologies are calculated for a 2ºx2º box surrounding the NAB site Chl a, PAR, and bbp are derived from SeaWiFS data, MLD from the FNMOC model * Loisel and Stramski relationships were employed by assuming l-1 spectral cp slope ** Regression fits (± 95% confidence) are the result of >1000 non-parametric bootstrap samples 3. Methods 5. Validation of Measurements 6. Conclusions and Significance ~ • Time series of underway optics show high frequency variability • that spans the entire dynamic range observed during cruise • High scattering (cp) per Chl a is observed, but is consistent with • previous N. Atlantic data published • What causes this other than coccolithophorids? • bbp per Chl a is higher than predicted based on relationships • extrapolated from more oligotrophic environments • These are the first measurements made of this type in • significant numbers. • bbp and cp are highly correlated throughout entire record AND • degree of relationship is consistent with previously collected data • This suggests that the two indices are sensitive to the • same pool of particles OR that different pools of particles • strongly covary (and the resulting PSD is conserved) • Optics data collected with underway system are NOT • significantly different than that measured outside of ship (+- 10%) • This is surprising because of differences observed in particle • size spectra. • Both HPLC and ap indices show changes in dominant phytoplankton • groups • Data reported here are measurements conducted during the NAB 2008 cruise on the R/V Knorr using the ship’s clean flow-through seawater supply. • A. OPTICAL MEASUREMENTS: • C-star beam attenuation (cp) at 526 and 660 nm • ECO-BB3 (bbp) at 470 and 526 nm • The instrument was installed in a custom-made • chamber that serves as a light trap while measuring • flow-through backscattering. The chamber walls • themselves do not contribute a measurable signal • (Slade et al. 2008; Dall’Olmo et al. 2008). • FRR, variable fluorescence (not shown here) • Coulter Counter particle size distribution (PSD) • ACs /AC9 (ap, bp, cp) every ~4nm from 400-750nm • To account for combined effects of dissolved signals, instrumental drifts, and biofouling, an • automatic valve directed bulk seawater through a 0.2-mm nylon cartridge filter for ten • minutes every hour. cp and ap were computed by subtracting the interpolated 0.2-mm filtered • values from the bulk signal . This procedure allows determination of calibration-independent • particulate beam-attenuation and absorption coefficients with uncertainties determined mostly • by instrument precision (Boss et al., 2007; Slade et al., 2008; Dall’Olmo et al., 2008). • Periodic comparisons of flow through measurements with bulk seawater taken from the • surface CTD were also conducted (see results in Section 5). • B. DISCRETE BIOGEOCHEMICAL MEASUREMENTS • HPLC pigments • Particulate organic carbon (POC) • Measurements made primarily following JGOFS protocols, but using multiple volumes • (0.5L,1L, 2L) to determine blank value from regression • (c.f. Menzel, 1966; Moran et al., 1999; Turnewitsch et al., 2007) • A. Median bbp are similar to previously published studies (0.01±0.002) • Estimated n (real part of index of refraction) are in correct range (1.09±0.01) • C. Direct comparison of ap, cp, bbp , and particle size distribution (PSD) in flowthru • system and surface CTD water Particles ml-1mm-1 % bias * % bias = CTD – flowThru) / CTD * 100 ESD (mm) D. Matchups of discrete and optics-based estimates of Chl a * Regression fits (± 95% confidence) are the result of >1000 non-parametric bootstrap samples (Note difference in slopes) Chl-ACs is calculated by absorption baseline method (Davis et al., 1997; Boss et al., 2007) = [ap(676) (39/65ap(650) + 26/65ap(715))]/0.014 Acknowledgments: The authors wish to thank to the crew of the R/V Knorr and all science personnel who participated in the 2008 NAB Experiment. Funding was provided by NASA grant NNX08AK70G. For further information please contact Toby Westberry (toby.westberry@science.oregonstate.edu). This poster is dedicated to the loving memory of Fredrick Charles Crebassa. E. Modeling using remote sensing reflectance and optical closure (not done yet)