Download
1 / 5
50 likes | 192 Vues
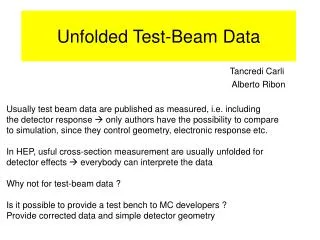
Unfolded Test-Beam Data. Tancredi Carli. Alberto Ribon. Usually test beam data are published as measured, i.e. including the detector response only authors have the possibility to compare to simulation, since they control geometry, electronic response etc.

E N D
Unfolded Test-Beam Data Tancredi Carli Alberto Ribon Usually test beam data are published as measured, i.e. including the detector response only authors have the possibility to compare to simulation, since they control geometry, electronic response etc. In HEP, usful cross-section measurement are usually unfolded for detector effects everybody can interprete the data Why not for test-beam data ? Is it possible to provide a test bench to MC developers ? Provide corrected data and simple detector geometry
Prepare test-bench • In a typical data analysis, e.g. a cross-section measurement, you do: • 1) Simulate the detector response using event generator and G4 detector sim • 2) Calculate “truth” observable using event generator • 3) Divide the two, to obtain correction factor • 4) Publish “corrected” data unfolded for detector response Experiments could “publish” test-beam data in the same way: 1) Get observables from detector simulation 2) Get observable from “calibration hits”, i.e. true energy deposition in detector 3) Divide the two, to obtain corrected data 4) Provide (simplified) detector geometry via xml-file This xml-file contains only detector geometry and information where layer starts/ends, no cell information This is for most data enough ! Since cell geometry is not there, the test-bench only rather inclusive observables, e.g. Etot, dE/dx etc. For instance, lateral profiles Are not possible
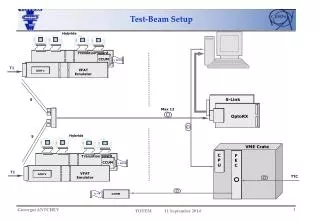
Test-bench Prototype for TB02 LAr Data Reconstructed Data Technology to implement basic detector geometry in simple xml-file is available (M. Gallas), this is done only once from Athena New meaning of “published” data, Provide: 1) xml-file 2) software calculating observables 3) Corrected data (numbers of histograms) 2002 Lar Barrel Test beam Relatively easy observable Elay1/Etot Corrected Data: Correction Factor MC uses only knowledge of layer end/start position and true energy deposition
Test-bench Prototype for TB02 LAr Data Reconstructed Data Elay1/Etot Corrected Data: Correction Factor
Remarks • Correcting the data for detector effect seems possible • ATLAS has the software to do that, since the true energy deposition in each • single piece of material is recorded (calibration hits) • For some observable things might be more complicated: • - Etot: detector repesonse systematically lower better to multiply factor, • than absorbing that in correction function • Need to investigate, if effects of beam-line should also be corrected • -Need correction for beam impurity, e.g. pion contamination in electron beam • Principle Problem ?: Data are corrected using MC that should be tested. • need corrections to be small • variation of corrections for different physics lists • should be small • Future Plan: Investigate more complicated observable like • longitudinal pion profiles