Download
1 / 27
270 likes | 422 Vues
Use of Outcome Measures in Payment Reform: Rationale. Patrick S. Romano, MD MPH UC Davis Center for Healthcare Policy and Research AHRQ Annual Conference Bethesda, MD; September 14, 2009. Overview.

E N D
Use of Outcome Measures in Payment Reform: Rationale Patrick S. Romano, MD MPH UC Davis Center for Healthcare Policy and Research AHRQ Annual Conference Bethesda, MD; September 14, 2009
Overview • Variation in quality and outcomes is substantial and is driven (at least somewhat) by provider behavior • Suboptimal health care quality and outcomes contribute to excess costs • Higher quality is not generally associated with higher overall costs, but improving quality often reduces provider revenue under current payment systems • Questions and answers
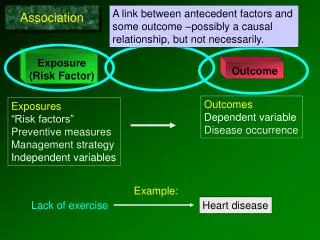
Variation in quality and outcomes is substantial and is driven (at least somewhat) by provider behavior
4 Source: Commonwealth Fund National Scorecard on U.S. Health System Performance, 2008 Chronic disease proxy outcomes: Managed care plan distribution, 2006 Percent of adults with diagnosed diabetes whose HbA1c level <9.0% Percent of adults with hypertension whose blood pressure <140/90 mmHg Note: Diabetes includes ages 18–75; hypertension includes ages 18–85. Data: Healthcare Effectiveness Data and Information Set (NCQA 2007).
5 Source: Commonwealth Fund National Scorecard on U.S. Health System Performance, 2008 Hospitals: Quality of care for heart attack, heart failure, and pneumonia Percent of patients who received recom-mended care for all three conditions* Percent of patients who received recommended care for each condition* * Composite for heart attack care consists of 5 indicators; heart failure care, 2 indicators; and pneumonia care, 3 indicators.Overall composite consists of all 10 clinical indicators. See report Appendix B for description of clinical indicators. Data: A. Jha and A. Epstein, Harvard School of Public Health analysis of data from CMS Hospital Compare.
6 Source: Commonwealth Fund National Scorecard on U.S. Health System Performance, 2008 Hospital-Standardized Mortality Ratios Standardized ratios compare actual to expected deaths, risk-adjusted for patient mix and community factors.* Medicare national average for 2000=100 mean Decile of hospitals ranked by actual to expected deaths ratios * See report Appendix B for methodology. Data: B. Jarman analysis of Medicare discharges from 2000 to 2002 and from 2004 to 2006 for conditions leading to 80 percent of all hospital deaths.
7 Source: Commonwealth Fund National Scorecard on U.S. Health System Performance, 2008 Nosocomial infections in intensive care unit patients, 2006 Data: Reported by 211 hospitals participating in the National Healthcare Safety Network (Edwards et al. 2007). 7
8 Source: Commonwealth Fund National Scorecard on U.S. Health System Performance, 2008 Nosocomial infections in intensive care unit patients, 2006 Data: Reported by 211 hospitals participating in the National Healthcare Safety Network (Edwards et al. 2007). 8
9 Source: Commonwealth Fund National Scorecard on U.S. Health System Performance, 2008 Potentially preventable adverse events and complications of care in hospitals among Medicare beneficiaries across states, 2005-2006 Percent *Surgical patients with postoperative pneumonia, urinary tract infection (2005 only), or venous thromboembolic event ** Patients with serious bleeding associated with intravenous heparin, low molecular weight heparin, or warfarin, or hypoglycemia associated with insulin or oral hypoglycemics. Data: M. Pineau, Qualidigm analysis of Medicare Patient Safety Monitoring System. 9
Suboptimal health care quality and outcomes contribute to excess costs
“Business case”:Impact of preventing PSI on mortality, LOS, chargesNIS 2000 analysis by Zhan & Miller, JAMA 2003;290:1868-74 Excess mortality, LOS, and charges computed from mean values for PSI cases and matched controls.
“Business case”:Impact of preventing PSI on mortality, LOS, VA costVA PTF 2001 analysis by Rivard et al., Med Care Res Rev; 65(1):67-87 Excess mortality, LOS, and charges computed from mean values for PSI cases and matched controls.
Uncertain “business case” for some PSIsZhan & Miller, JAMA 2003;290:1868-74 Rosen et al., Med Care 2005;43:873-84 * All differences NS for transfusion reaction and complications of anesthesia in VA/PTF. † Mortality difference NS for foreign body in VA/PTF.
Thomson Reuters analysis of PSI business caseFoster et al., AcademyHealth 2009 • AHRQ Patient Safety Indicators (PSIs) were used to identify selected medical and surgical injuries • Thomson Reuters Projected Inpatient Data Base for federal FY 2007 (based on 21.5 million discharge abstracts from 2,620 acute hospitals) • Regression models were used to adjust for age, sex, clinical category, and comorbid conditions • Model coefficients were used to estimate annual impact attributable to PSI events • Total impact: • almost 30,000 excess deaths • 3.4 million excess hospital days • $9 billion in excess hospital costs
International evidence of “business case” from case control analysis of PSIs in NHS England All differences were statistically significant at p<0.001 except as noted. Raleigh VS, Cooper J, Bremner SA, Scobie S, Patient safety indicators for England from hospital administrative data, BMJ 2008, 337; a1702.
Quality is not generally associated with overall costs, but improving quality often reduces provider revenue given current payment systems
Total Medicare payments vary widely across Hospital Referral Regions
18 Source: Commonwealth Fund National Scorecard on U.S. Health System Performance, 2008 Quality and costs of care for Medicare patients hospital-ized for heart attacks, hip fractures, or colon cancer,by Hospital Referral Regions, 2004 Median relative resource use=$27,499 Quality of Care* (1-Year Survival Index, Median=70%) * Indexed to risk-adjusted 1-year survival rate (median=0.70). ** Risk-adjusted spending on hospital and physician services using standardized national prices. Data: E. Fisher, J. Sutherland, and D. Radley, Dartmouth Medical School analysis of data from a 20% national sample of Medicare beneficiaries.
Estimated excess 90-day payments due to AHRQ PSIs, 2001-2 MarketScan Commmercial Claims Database (5.6 m enrollees) All differences in total excess payments were statistically significant at p<0.001 except for Technical Problems and Wound Problems, after adjusting for propensity based on 92 collapsed DRGs, 20 comorbidities, and 12 other patient characteristics. Encinosa and Hellinger, HSR 2008;43:2067-85.
Heart failure Pediatric asthma Diabetes* 21 Source: Commonwealth Fund National Scorecard on U.S. Health System Performance, 2008 Ambulatory care-sensitive hospitalizations (AHRQ PQI) for select conditions across states Adjusted rate per 100,000 population ^ 2002 data for heart failure and diabetes; 2003 data for pediatric asthma. *Combines four diabetes admission measures: uncontrolled, short-term complications, long-term complications, and lower extremity amputations. Data: National average—Healthcare Cost and Utilization Project, Nationwide Inpatient Sample; State distribution—State Inpatient Databases; not all states participate in HCUP (AHRQ 2005, 2007a).
22 Source: Commonwealth Fund National Scorecard on U.S. Health System Performance, 2008 Medicare admissions for AHRQ PQIs, rates and associated costs, by Hospital Referral Regions Rate of ACS admissions per 10,000 beneficiaries Costs of ACS admissions as percent of all discharge costs Percentiles Percentiles See report Appendix B for complete list of ambulatory care-sensitive conditions used in the analysis. Data: G. Anderson and R. Herbert, Johns Hopkins University analysis of Medicare Standard Analytical Files (SAF) 5% Inpatient Data.
Extend Prevention Quality Indicators (PQIs) to EDs Modify and test existing PQIs using State Emergency Department Databases (SEDD) Feed “enhanced PQIs” into the Preventable Hospitalization Costs Mapping Tool Develop AHRQ ED Patient Safety Indicators (EDPSIs) Pilot AHRQ Efficiency and Resource Use Indicators Fully incorporate “Present on Admission” logic into the AHRQ PSIs Current algorithms grafted POA onto previous algorithms, resulting in enhanced PPV/specificity but no gain in sensitivity Reconsider necessity and value of PSI denominator exclusions (i.e., nursing home transfers for Pressure Ulcer) and numerator restrictions (i.e., procedures) Planned AHRQ QI enhancements to support payment reform
25 Source: Commonwealth Fund National Scorecard on U.S. Health System Performance, 2008 Potentially inappropriate antibiotic prescribing, children with sore throat:Managed care plan distribution, 2006 Percent of children prescribed antibiotics for throat infection without receiving a “strep” test* National Average Managed Care Plan Distribution, 2006 Note: National average includes ages 3–17 and plan distribution includes ages 2–18. * A strep test means a rapid antigen test or throat culture for group A streptococcus. Data: National average—J. Linder, Brigham and Women's Hospital analysis of National Ambulatory Medical Care Survey and National Hospital Ambulatory Medical Care Survey; Plan distribution—Healthcare Effectiveness Data and Information Set (NCQA 2007). 25
26 Source: Commonwealth Fund National Scorecard on U.S. Health System Performance, 2008 Managed care health plans: Potentially inappropriate imaging studies for low back pain, by plan type Percent of health plan members (ages 18–50) who received an imaging study within 28 days following an episode of acute low back pain with no risk factors Managed care plans (2006) Annual averages * Denotes baseline year. Data: Healthcare Effectiveness Data and Information Set (NCQA 2007).