Download
1 / 21
210 likes | 339 Vues
Overview of IEPM-BW - Bandwidth Testing of Bulk Data Transfer Tools. Connie Logg & Les Cottrell – SLAC/Stanford University Presented at the Internet 2 May 8, 2002. Partially funded by DOE/MICS Field Work Proposal on Internet End-to-end Performance Monitoring (IEPM), also supported by IUPAP.

E N D
Overview of IEPM-BW - Bandwidth Testing of Bulk Data Transfer Tools Connie Logg & Les Cottrell – SLAC/Stanford University Presented at the Internet 2 May 8, 2002 Partially funded by DOE/MICS Field Work Proposal on Internet End-to-end Performance Monitoring (IEPM), also supported by IUPAP
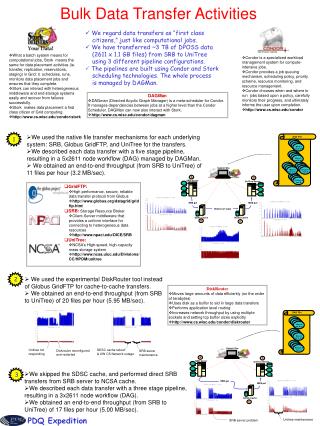
Why? • Grid computing will require reliable, scalable, predictable, and automatable transfer tools to distribute large volumes of data all over the world • We need to understand the requirements, characteristics and complications of performing such transfers in order to optimize the use of existing tools, and/or to design and develop new ones • We need to know how to schedule and configure the automated transfers • We need to understand how to monitor performance, test applications, and troubleshoot performance issues
What? • We are developing a framework for testing and analyzing various bandwidth sensors and data transfer tools for Grid computing • These tools are being used to gather, reduce, analyze, and publicly report on the results. The reports include: • Web accessible data • Tables • Time series plots • Scatter plots to see correlations • Histograms • Comparisons of the active and passive measurements
What – Cont. • These tools will be useful for: • Testing new transfer applications and sensors • Analyzing performance to new domains • Baselining performance • Forecasting performance • Performing continuous measurements when needed due to performance and/or other changes • Evaluating passive vs active performance measurements
Where? • To the world! • Currently we have 34 nodes in 8 countries around the world to which we are running the tests • We plan on adding more
PPDG (Particle Physics Data Grid) GriPHyN (Grid Physics Network) PPDG and GriPHyN EDG (European Data Grid) ESnet INFN/Milan Roma DL RAL UDEL SOX NASA BNL NIKHEF UFL IU TRIUMF WISC IN2P3 FNAL Rice ANL RIKEN CERN UTDallas JLAB KAIST Caltech CalREN & Internet2 ORNL KEK SDSC LANL LBNL SLAC Stanford NERSC
Infrastructure Overview • Must get a system and accounts allocated for testing • Master configuration file with specifications for setting up and configuring the tests to each node • “remoteos.pl” uses master configuration file to set up remote hosts, push out latest releases of the sensors • “run-bw-tests” script which runs the tests approximately every 90 minutes (same code runs from command line as well as cron) • “codeanal” analyzes the performance of the “run-bw-tests” code • “post test processing” which extract the data and does the plots and analysis
“run-bw-tests” • Sequentially runs the following sensors • Ping • Traceroute • Iperf (10 seconds) • Bbcp memory to memory (10 seconds) • Bbcp disk to disk (file sized from memory to memory) • Bbftp disk to disk (save file as bbcpmem) • Pipechar (phasing out) Using the info in the configuration file • All text from the sensor runs is saved to a log file
“codeanal” • Looks at the logs of the run-bw-tests to analyze how well the test code itself performed. • Makes a summary web page • Useful for getting a picture of how things are working and patterns of failure
“codeanal” Analysis Diagnostic codes: NR– test not run; - NN– test timed out CTO– connection timed out
Analysis, Displays and Results • Time series plots • Scatterplots panels for visualizing correlations • Histogram panels for visualizing distribution of the data values • Scatterplots of all data for each sensor • Correlation tables • “Forecasting” experiments • Passive vs Active measurement comparisons
Time Series Plots • Overplot all sensors
0 450 0 450 0 450 Scatterplot Panel Show correlations with scatterplot panel Plot the sensors versus each other IPERF BBCP 0 450 0 450
Histogram Panel for each Node Shows distribution of results
Overplot all Sensor Results for all Nodes Bbcpmem vs Iperf for all nodes Bbcpdisk vs Iperf for all nodes
Compare Sensors on Different Speed Links • Limiting factors are disk speeds in left example BBCPdisk < BBCPmem • Low speed links track well High Available Bandwidth Low Available Bandwidth
“Forecasting” • Red w/errorbars is average of 5 previous measurements & std. dev. • Blue is actual value
Active vs Passive Measurements • All the traffic going in and out of SLAC is recorded by the Cisco switch at our border using Netflow. • Just starting to compare the passive measurements of our active measurements. • Preliminarily, the results look promising.
Active vs Passive Compare the active measurements and the passive measurement of the active measurements Iperf SLAC to Caltech (Feb-Mar ’02)
Iperf R=.98 Passive vs Active from SLAC to ORNL“Track” Bbcp Mem R=.75 Passive Bbcp Disk R=.92 Bbftp R=.4 Active Time (21 days)
Futures • Expand deployment – port to Linux – other sites • Integrate with WEB100 (retries, packet loss) • Add more sensors (GridFTP, pathrate, pathload) • Investigate further the comparison between active and passive measurements • Look at passive measurements of users’ transfers