Download
1 / 26
260 likes | 379 Vues
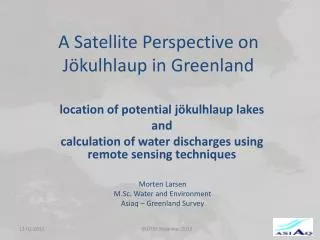
A Satellite Perspective on Jökulhlaup in Greenland. location of potential jökulhlaup lakes and calculation of water discharges using remote sensing techniques. Morten Larsen M.Sc . Water and Environment Asiaq – Greenland Survey. Table of contents. Introduction Study area

E N D
A Satellite Perspective on Jökulhlaup in Greenland location of potential jökulhlaup lakes and calculation of water discharges using remote sensing techniques Morten Larsen M.Sc. Water and Environment Asiaq – Greenland Survey INUTEK Nytårskur 2012
Table of contents Introduction Studyarea Location of potential jökulhlaups lakes Water volume assessment Verification INUTEK Nytårskur 2012
1. Introduction What is a jökulhlaup? A jökulhlaup is a very intense flood where a water reservoir releases a large amount of water abruptly. The water reservoir is filled by water over time and when the level reaches a critical point the reservoir is emptied. GeoBasis August 11th, 2009 GeoBasis August 12th, 2009 INUTEK Nytårskur 2012
1. Introduction • The aim of the work: • To develop a remote sensing method for locating potential jökulhlaup lakes • To develop a remote sensing method for assessing the water volume during a jökulhlaup. • To build up knowledge about remote sensing in Greenland Why developing the methods? Jökulhlaups influences the ecosystem Jökulhlaups are a risk for human activity in downstream areas Jökulhlaups affects the design and construction of hydro power plants Jökulhlaup frequency and magnitude can be used in climate change research INUTEK Nytårskur 2012
Table of contents • Introduction • Studyarea • Location of potential jökulhlaups lakes • Water volume assessment • Verification INUTEK Nytårskur 2012
2. Study area Study area 16.000 km2 Lake North • Hydrological station Maps by: KMS Lake South INUTEK Nytårskur 2012
Table of contents • Introduction • Studyarea • Location of potential jökulhlaups lakes • Water volume assessment • Verification INUTEK Nytårskur 2012
3. Location of potential jökulhlaups Mappingglaciers Mappinglakes Mappingsurfaceanomalies Spatial location analysis Potential jökulhlaup lakes INUTEK Nytårskur 2012
3. Location of potential jökulhlaups • 1st task - Mapping lakes • Tasseled cap transformation • Surface classified as water if the brightness index > 0.4 and the wetness index > 0 • Multi-year observation: Time series of LANDSAT scenes from late summers 2003-2009 • If surface is classified as water in at least 5 out of 6 years it is mapped as water INUTEK Nytårskur 2012
3. Location of potential jökulhlaups • 2nd task - Mapping glaciers • New image produced as average of the Tasseled cap parameters in the LANDSAT time series • Unsupervised classification with 50 spectral classes • Spectral classes thematically coded into glacier ice or non-glacier ice INUTEK Nytårskur 2012
3. Location of potential jökulhlaups 3rd task - Mapping surface anomalies The NDVI anomaly is the difference between NDVI for a given year and mean NDVI for all years in the LANDSAT time series. INUTEK Nytårskur 2012
3. Location of potential jökulhlaups 4th task – Spatial location analysis Glacier ice Surface anomaly Lake INUTEK Nytårskur 2012
3. Location of potential jökulhlaups Results • Discussion • All in all the method showed good results • Ice covered lakes were difficult to classify; Two known jökulhlaups were not selected due to this problem • Further development in discriminating between glacier and lake ice is needed • Only jökulhlaup with great changes in the surface area are mapped INUTEK Nytårskur 2012
Table of contents • Introduction • Studyarea • Location of potential jökulhlaups lakes • Water volume assessment • Verification INUTEK Nytårskur 2012
4. Water volume assessment Developing a method only based on satellite images Water volume difference: • The method: • Extract a DEM from ASTER stereo images at lowest possible water level • Find a relation between the surface area and the volume in the lake • Estimate water surface areas from a LANDSAT time series • Calculate water volumes in the lake from the relation water volume (beforejökulhlaup) - water volume (after jökulhlaup) = water volume (jökulhlaup) INUTEK Nytårskur 2012
4. Water volume assessment DEM extracted for Lake North August 8th, 2004 Relation between the water surface area and the volume INUTEK Nytårskur 2012
4. Water volume assessment The water surface area time series LANDSAT scenes from 1999-2010 INUTEK Nytårskur 2012
4. Water volume assessment Water volumes 1,98 km3 INUTEK Nytårskur 2012
Table of contents • Introduction • Studyarea • Location of potential jökulhlaups lakes • Water volume assessment • Verification INUTEK Nytårskur 2012
5. Verification • Hydrological station Lake North Lake North Lake South Lake South Lake South INUTEK Nytårskur 2012
5. Verification ISTA water balance equation: Qjökulhlaup * dt + Qinflow * dt = QISTA * dt + dVOLISTA where Qjökulhlaup is inflow from jökulhlaup [m3/s] Qinflow is inflow from other sources [m3/s] QISTA is discharge out of Lake ISTA [m3/s] t is time [s] VOLISTA is volume of water stored in Lake ISTA [m3] Qinflow Qjökulhlaup VOLISTA Qinflow QISTA Qinflow INUTEK Nytårskur 2012
5. Verification Estimating Qinflow: Qjökulhlaup * dt + Qinflow* dt = QISTA * dt + dVOLISTA Qinflowis mainly from the glacier Qinflow Qinflow Qinflow INUTEK Nytårskur 2012
5. Verification Estimating the water volume: Qjökulhlaup * dt + Qinflow * dt = QISTA * dt + dVOLISTA VOLISTA INUTEK Nytårskur 2012
5. Verification Estimating QISTA: Qjökulhlaup * dt + Qinflow * dt = QISTA* dt + dVOLISTA QISTA INUTEK Nytårskur 2012
5. Verification Results Discussion The method showed reliable results for the two test lakes Challenge to obtain ASTER stereo images immediately after a jökulhlaup Challenge to derived reliable surface areas from LANDSAT due to ice, shadows and clouds The method is less accurate for lakes with a steep bathymetry INUTEK Nytårskur 2012