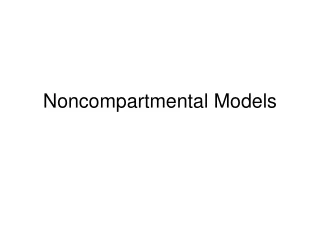
NONCOMPARTMENTAL ANALYSIS
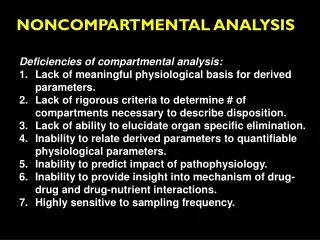
NONCOMPARTMENTAL ANALYSIS. Deficiencies of compartmental analysis: Lack of meaningful physiological basis for derived parameters. Lack of rigorous criteria to determine # of compartments necessary to describe disposition. Lack of ability to elucidate organ specific elimination.

NONCOMPARTMENTAL ANALYSIS
E N D
Presentation Transcript
NONCOMPARTMENTAL ANALYSIS • Deficiencies of compartmental analysis: • Lack of meaningfulphysiological basis for derived parameters. • Lack of rigorous criteria to determine # of compartments necessary to describe disposition. • Lack of ability to elucidate organ specific elimination. • Inability to relate derived parameters to quantifiable physiological parameters. • Inability to predict impact of pathophysiology. • Inability to provide insight into mechanism of drug-drug and drug-nutrient interactions. • Highly sensitive to sampling frequency.
GENERAL PRINCIPLES OF STATISTICAL MOMENTS MOMENT: A mathematical description of a discrete distribution. • STATISTICAL MOMENTS: • Utilized in chemical engineering to describe flow data • First applied tobiological systems by Perl and Samuel in 1969 to describe the kinetics of cholesterol
Examples of Statistical Moment Usage In statisticsIn physics weight N M0 (mean) Center of mass M1 (variance) Moment of inertia M2 (skewness) M3 (kurtosis) M4
In statistics, the mean is a measure of a sample mean and is actually an estimate of the true population mean. In pharmacokinetics, we can calculate the moment of the theoretical probability density function (i.e., the solution of a differential equation describing the plasma concentration time data), or we can calculate moments from measured plasma concentration-time data. These curves are referred to as sample moments and are estimates of the true curves.
Assume a theoretical relationship of C(t) as a function of time. The non-normalized moments, Sr , about the origin are calculated as:
Non-normalized momentsKinetic parameter AUC Area under the curve AUMC Area under the moment curve
From: Rowland M, Tozer TN. Clinical Pharmacokinetics – Concepts and Applications, 3rd edition, Williams and Wilkins, 1995, p. 487.
Normalized momentsKinetic parameter First moment: MRT Mean residence time
AREA DETERMINATION A. Integration of Specific Function • Must elucidate the specific function • Influenced by the quality of the fit
B. Numerical Integration • Linear trapezoidal • Log trapezoidal
B. Numerical Integration • Linear trapezoidal
B. Numerical Integration • Linear trapezoidal Advantages: Simple (can calculate by hand) • Disadvantages: • Assumes straight line btwn data points • If curve is steep, error may be large • Under or over estimate depends on whether curve is ascending of descending
B. Numerical Integration • Linear trapezoidal • Log trapezoidal
B. Numerical Integration • Linear trapezoidal • Log trapezoidal • Disadvantages: • Limited application • May produce large errors on an ascending curve, near the peak, or steeply declining polyexponential curve • Advantages: • Hand calculator • Very accurate for mono-exponential • Very accurate in late time points where interval btwn points is substantially increased
B. Numerical Integration • Linear trapezoidal • Log trapezoidal • Extrapolation to infinity Assumes log-linear decline
AUMC Determination AUC Determination C x t (mg/L)(hr) 0 2.00 3.39 3.50 3.01 2.00 0.45 Area (mg-hr2/L) - 1.00 5.39 6.89 6.51 7.52 9.80 37.11 Time (hr)C (mg/L) 0 2.55 1 2.00 3 1.13 5 0.70 7 0.43 10 0.20 18 0.025 Area (mg-hr/L) - 2.275 3.13 1.83 1.13 0.945 0.900 Total 10.21
CLEARANCE CONCEPTS Q Q ORGAN Cv Ca elimination If Cv < Ca, then it is a clearing organ
Rate In = QCa Rate Out = QCv Rate of elimination = QCa – QCv = Q(Ca – Cv)
Extraction Ratio: Ratio of the rate of xenobiotic elimination and the rate at which xenobiotic enters the organ.
Clearance: The volume of blood from which all of the drug would appear to be removed per unit time.
Relationship between CL & Q Since CL = QE, if E~1: CL Q Perfusion rate-limited clearance
Total Clearance Total (systemic) Clearance:
Total Clearance Total (systemic) Clearance:
Additivity of clearance Rate of elimination = Rate of Renal Excretion + Rate of Hepatic Metabolism Dividing removal rate by incoming concentration: Total Clearance = Renal Clearance + Hepatic Clearance CLT = CLR + CLH
Exception: sig. pulmonary elimination From: Rowland M, Tozer TN. Clinical Pharmacokinetics – Concepts and Applications, 3rd edition, Williams and Wilkins, 1995, p. 12.
100 mg drug administered to a volunteer resulted in 10 mg excreted in urine unchanged:
Application of Clearance Concepts Prediction of the effect of pathophysiological changes A new antibiotic has just been introduced onto the market. Currently, there are no studies examining the effect of renal disease on the pharmacokinetics of this compound. Is dosage adjustment necessary for this drug when used in pts with renal failure? How can we gain some insight into this question? A study in normal volunteers was recently published and the following data was included (mean):
Application of Clearance Concepts Prediction of the effect of pathophysiological changes CLT = 1.2 L/hr Div = 500 mg Amount in urine unchanged = 63 mg
Mechanisms of altered elimination Verapamil has been shown to elevate serum digoxin concentrations in patients receiving both drugs concurrently. A study by Pedersen et al (Clin Pharmacol Ther 30:311-316, 1981.) examined this interaction with the following results.: CLT 3.28 2.17 CLNR 1.10 0.44 Treatment Digoxin Dig + verapamil CLR 2.18 1.73
STEADY-STATE VOLUME OF DISTRIBUTION VP VT Cf Cf Cbt Cbp
VP VT Cf Cf Cbt Cbp CP= Cf+ Cbp CT= Cf + Cbt
At steady-state: Substitute:
Calculation via moment analysis: • Assumptions: • Linear disposition • Administered and eliminated via sampling site • Instantaneous input
If administration via a short term infusion: K0= infusion rate T = infusion duration
MEAN RESIDENCE/TRANSIT TIME Administration of a small dose may represent a large number of molecules: Dose = 1 mg MW = 300 daltons # of molecules = (10-3g/300) x (6.023 x 1023) ~2 x 10¹⁸ molecules
Instantaneous administration of the entire dose will result in xenobiotic molecules spending various amounts of time in the body. Evaluation of the time various molecules spend in the body (residence time) can be characterized in the same manner as any statistical distribution. Mean residence time: The average time the molecules of a given dose spend in the body.
A conceptual understanding can be gained from the following example: Assume a child received 20 dimes for his birthday and immediately places them in his piggy bank. Over the next month, he periodically removes 1 or more dimes from the piggy bank to purchase candy. Specifically, 3 days after placing the coins in his bank he removes 5 dimes, on day 10 he removes 4 dimes, on day 21 he removes 6 dimes and on day 30 he removes 5 dimes. At the 30th day after placing the coins in his bank, all of the coins have been removed. Hence, the elimination of the deposited dimes is complete. The MRT of the dimes in the piggy bank is simply the sum of the times that coins spend in the bank divided by the number of dimes placed in the bank.
MRT can be determined for any given number of drug molecules (Ai) that spend a given amount of time (ti) in the body:
The mean rate of drug leaving the body relative to the total amount eliminated can be expressed in terms of concentration:
This is not a definition of MRT, rather it is a means of calculating MRT when CL is constant. When calculated in this fashion, it is often said that MRT is a function of the route of administration. However, MRT is independent of the route. Meant Transit Time (MTT): The average time for xenobiotic molecules to leave a kinetic system after administration.