Download
1 / 13
130 likes | 255 Vues
ASC Tri-Lab Code Development Tools Workshop Thursday, July 29, 2010. Vampir and VampirTrace: Event Tracing and Visualization. Lawrence Livermore National Laboratory, P. O. Box 808, Livermore, CA 94551.

E N D
ASC Tri-Lab Code Development Tools Workshop Thursday, July 29, 2010 Vampir and VampirTrace: Event Tracing and Visualization Lawrence Livermore National Laboratory, P. O. Box 808, Livermore, CA 94551 This work performed under the auspices of the U.S. Department of Energy by Lawrence Livermore National Laboratory under Contract DE-AC52-07NA27344 LLNL-PRES-426128
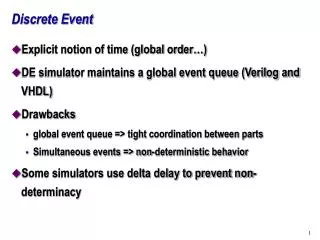
Profiling vs Event Tracing • Profiling • Easy to use, low overhead, small files • Statistical information • Event Tracing • High overhead • Application perturbation • Trace file storage • Fine detail • Time-based effects • Flexibility
Trace generation with VampirTrace • Developed by the Center for Information Services and High Performance Computing (ZIH) of TU Dresden • Open Source library (BSD license) • LLNL-funded OTF trace format • Provides tracing functionality for a large set of metrics • MPI • Threads: OpenMP and pthreads • Application function entry/exit • Performance Counters • Memory and I/O Tracing • Profiling mode
Vampir trace analysis & visualization • Proprietary trace analysis and visualization tool • Includes • Summary • Timelines • Global • Process • Charts • Communication grid
Usage • Re-build application with VampirTrace wrapper scripts • C : vtcc –vt:cc mpicc • Fortran : vtf77 –vt:f77 mpif77 • C++ : vtCC –vtcxx mpiCC • Options : vtcc –vt:help • No application instrumentation : -vt:inst manual • Run application • Examine trace data with Vampir or VampirServer • vampir test_HPCCG.otf • vng • srun –n 4 –ppdebug vngd
How to examine performance data? • Vampir Summary Chart
How to reduce tracing overhead? • Trace generation (VampirTrace) • Tracing limits • 32MB trace buffer • Default is to deactivate tracing when buffer is full. • Event filter • Run-time filter file • vtfilter command • Trace Visualization (VampirServer) • Client/Server model for viewing very large tracefiles
References • Vampir • http://www.vampir.eu • VampirTrace • http://www.tu-dresden.de/zih/vampirtrace