Download
1 / 31
320 likes | 399 Vues
Learn about Geotechnology as a mega-technology for the 21st century, its role in map analysis, modeling, and future directions. Explore GIS, GPS, remote sensing, and multimedia mapping concepts. Discover spatial analysis tools and frameworks.

E N D
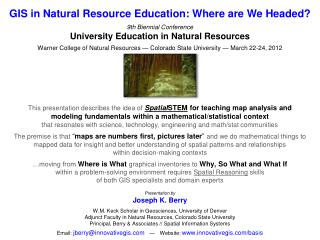
Geotechnology in Transition: Evolution, Current Practice, Trends and Future Directions that are Moving Us Beyond Mapping Geospatial Workshop for the City of Oslo – September 2, 2010 Understanding… 1) What GIS IS …and Is Not, 2) Nature of Grid-based Mapped Data, 3) Map Analysis and Modeling, 4) Multimedia Mapping, and 5) Where GIS Is Headed Presentation byJoseph K. Berry W.M. Keck Scholar in Geosciences, University of DenverPrincipal, Berry & Associates // Spatial Information Systems2000 S. College Ave, Suite 300, Fort Collins, CO 80525Phone: (970) 215-0825 Email: jberry@innovativegis.com Website at www.innovativegis.com/basis
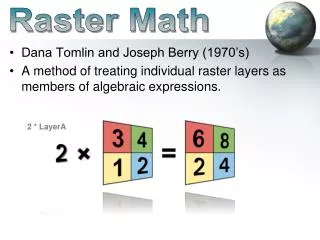
(Nanotechnology)Geotechnology(Biotechnology) Mapping involves precise placement of physical features and inventories (Discrete/Graphic) Modeling involvesanalysis of spatial relationships and patterns (Continuous/Numerical) Descriptive Mapping Prescriptive Modeling …an enabling technology used in spatial reasoning, dialog and decision-making— Geotechnologyis one of the three "mega technologies" for the 21st century and promises to forever change how we conceptualize, utilize and visualize spatial relationships in scientific research and commercial applications (U.S. Department of Labor) Geographic Information Systems (map and analyze) Global Positioning System (location and navigation) Remote Sensing (measure and classify) GPS/GIS/RS The Spatial Triad is WhereWhat WhySo WhatWhat if… Map Analysis …provides “tools” for investigating spatial patterns and relationships (Berry)
Conceptual Framework for Map Analysis Geotechnology– one of the three mega-technologies for the 21st Century Global Positioning System (Location and Navigation) Remote Sensing (Measure and Classify) Geographic Information Systems (Map and Analyze) Spatial Triad 70sComputer Mapping(Automated Cartography) 80sSpatial Database Management(Mapping and Geo-query) 90sMap Analysis (Spatial Relationships and Patterns) Analytical Toolbox Spatial Analysis(Geographic Context) …analytical tools for characterizing “contextual spatial relationships” within and among mapped data, such as effective distance, optimal paths, visual connectivity and micro-terrain analysis. Specific classes of spatial analysis operations include Reclassify, Overlay, Proximity and Neighbors. Spatial Statistics(Numeric Context) …analytical tools for characterizing “numerical spatial relationships” within and among mapped data, such as density analysis, spatial interpolation, data mining, correlation and predictive modeling. Specific classes of spatial statistics include Surface Modeling, and Spatial Data Mining. 00sMultimedia Mapping (GIS/Internet/Visualization integration) (Berry)
Desktop Mapping Framework(Vector, Discrete) Click on… Info Tool Theme Table Distance Select Theme Zoom Pan Spatial Table (WHERE) Query Builder : Object ID X,Y X,Y X,Y : …identify tall aspen stands Attribute Table (WHAT) FeatureSpeciesetc. : : Object ID Aw : : Big …over 400,000m2 (40ha)? Discrete, irregular map features (objects) Points, LinesandAreas (Berry)
Click on… Shading Manager Zoom Pan Rotate Display Continuous, regular grid cells (objects) Points, Lines, AreasandSurfaces MAP Analysis Framework (Raster, Continuous) Calculating Slope and Surface Flow Video (click) Grid Analysis …calculate a slope map and drape on the elevation surface Grid Table : --, --, --, --, --, --, --, --, --, --, --, --, --, 1210, --, --, --, --, --, : Slope= rise/run (Berry)
Basic Grid Data Structure (Analysis Frame) A Grid Mapconsists of a matrix of numbers with a value indicating the characteristic /condition at each grid cell location Map Stack …forming a geo-registered set of “map layers” organized as a Map Stack Points, Lines , Areas Surfaces Points, Lines , Areas Grid Map Layer Mesh Fill “…preconditions geographic space for analysis” (Implicit Topology) Analysis Frame The Analysis Frame provides consistent “parceling” needed for map analysis and extends discrete point, line and areal features to continuous map surfaces Col 3, Row 22 Data listing for a Map Stack Drill-down Layer Mesh (Berry)
Desktop Mapping vs.Map Analysis Desktop Mapping Data Space Field Data Map Analysis Geographic Space Standard Normal Curve Average = 22.0 StDev = 18.7 22.0 “Maps are numbers first, pictures later” Desktop Mappinggraphically links generalized statistics to discrete spatial objects (Points, Lines, Polygons) —non-spatial analysis X, Y, Value Point Sampled Data (Numeric Distribution) (Geographic Distribution) 40.7 …not a problem Discrete Spatial Object Continuous Spatial Distribution High Pocket Spatially Generalized Spatially Detailed Discovery of sub-area… Adjacent Parcels Map Analysismap-ematically relates patterns within and among continuous spatial distributions (Map Surfaces) —spatial analysis and statistics (Berry)
Recall that in the beginning we had… Computer Mappingautomates the cartographic process (70s) Spatial Database Managementlinks computer mapping with database capabilities (80s) Mapping and Geo-query Map Analysisrepresentation of relationships within and among mapped data (90s) • Spatial Analysis (Contextual) • Spatial Statistics (Numerical) Map-ematics But the nature of the digital map is taking us beyond mapping… …new analytic tools involving entirely new spatial reasoning skills (Berry)
Traditional GIS Forest Inventory Map • Points, Lines, Polygons • Discrete Objects • Mapping and Geo-query Spatial Statistics Traditional Statistics Spatial Distribution (Surface) Minimum= 5.4 ppm Maximum= 103.0 ppm Mean= 22.4 ppm StDEV= 15.5 • Mean, StDev (Normal Curve) • Central Tendency • Typical Response (scalar) • Map of Variance (gradient) • Spatial Distribution • Numerical Spatial Relationships Mapped Data Analysis Evolution (Revolution) Spatial Analysis Elevation (Surface) • Cells, Surfaces • Continuous Geographic Space • Contextual Spatial Relationships (Points, Lines , Areas) Now Later (Berry)
Calculating Slope and Flow (Spatial Analysis) Inclination of a fitted plane to a location and its eight surrounding elevation values (Neighbors) Slope (47,64) = 33.23% Slope map draped on Elevation Slope map Flow (28,46) = 451 Paths Elevation Surface Total number of the steepest downhill paths flowing into each location (Distance) Flow map draped on Elevation Flow map (Berry)
Erosion Potential Reclassify Overlay Reclassify Erosion_potential Slopemap Slope_classes Flow/Slope Reclassify “Simple” Fixed-width Buffer Flowmap Flow_classes But all buffer-feet are not the same… (slope/flow Erosion_potential) Protective Buffers …reach farther in areas of high erosion potential (Variable-width Buffer) Streams Simple Buffer Erosion_potential Deriving Erosion Potential & Buffers “as the crow flies” (Berry)
Distance away from the streams is a function of the erosion potential(Flow/Slope Class) with intervening heavy flow and steep slopes computed as effectively closer than simple distance— “as the crow walks” Distance Effective Erosion Distance Erosion Buffers Close Far Simple Buffer Heavy/Steep (far from stream) Erosion_potential Light/Gentle (close) Effective Buffers Streams Calculating Effective Distance (Variable-width Buffers) Accumulated Proximity animation (click) (See Beyond Mapping III, “Topic 24”, Overview of Spatial Analysis and Statistics, www.innovativegis.com/basis) (Berry)
Traditional GIS Forest Inventory Map • Points, Lines, Polygons • Discrete Objects • Mapping and Geo-query Spatial Statistics Traditional Statistics Spatial Distribution (Surface) Minimum= 5.4 ppm Maximum= 103.0 ppm Mean= 22.4 ppm StDEV= 15.5 • Mean, StDev (Normal Curve) • Central Tendency • Typical Response (scalar) • Map of Variance (gradient) • Spatial Distribution • Numerical Spatial Relationships Mapped Data Analysis Evolution (Revolution) Spatial Analysis Elevation (Surface) • Cells, Surfaces • Continuous Geographic Space • Contextual Spatial Relationships (Berry)
Phosphorous (P) Visualizing Spatial Relationships (Spatial Distributions) Geographic Distribution What spatial relationships do you SEE? …do relatively high levels of P often occur with high levels of K and N? …how often? …where? “Maps are numbers first, pictures later” Multivariate Analysis— each map layer is a continuous variable with all of the math/stat “rights, privileges and responsibilities” therewith …simply “spatially organized “ sets of numbers (matrices) (Berry)
Clustering Maps for Data Zones Groups of “floating balls” in data space identify locations in the field with similar data patterns– data zones or Clusters …a Map Stack is a spatially organized set of numbers …data distances are minimized within a group (intra-cluster distance) and maximized between groups (inter-cluster distance) using an optimization procedure (See Beyond Mapping III, “Topic 7”, Linking Data Space and Geographic Space, www.innovativegis.com/basis) (See Beyond Mapping III, “Topic 16”, Characterizing Spatial Patterns and Relationships, www.innovativegis.com/basis) (Berry)
The Precision Ag Process (Fertility example) Steps 1) – 3) Cyber-Farmer, Circa 1992 On-the-Fly Yield Map Map Analysis Step 4) Farm dB Prescription Map Variable Rate Application Step 5) Step 6) As a combine moves through a field it 1) uses GPS to check its location then 2)checks the yield at that location to 3) create a continuous map of the yield variation every few feet. This map is 4) combined with soil, terrain and other maps to derive that is used to 6) adjust fertilization levels every few feet in the field (Variable Rate Application; Site-specific Management) 5) a “Prescription Map” (See Beyond Mapping III, “Topic 16”, Characterizing Spatial Patterns and Relationships, www.innovativegis.com/basis) (Berry)
Recall that in the beginning we had… Computer Mappingautomates the cartographic process (70s) Spatial Database Managementlinks computer mapping with database capabilities (80s) Mapping and Geo-query Map Analysisrepresentation of relationships within and among mapped data (90s) • Spatial Analysis (Contextual) • Spatial Statistics (Numerical) Knock-your-socks-off Multimedia Mappingfull integration of GIS, Internet and visualization technologies (00s) • Map Delivery/Devices • Map Display • Geospatial Multimedia • Virtual Reality Map-ematics …4 thrusts driving MMM (Berry)
4)Virtual Reality Rendered Scenes Multimedia Mapping(00’s) 2)Map Display 1)Map Delivery/Devices Interactive Maps Crowd Sourcing <click> Fly-by <click> <click> Model Output Space and Time GPS/GIS Enabled Devices and Internet Mapping Animated Maps <click> …more on GIS & VR 3)Geospatial Multimedia Phone = Camera <click> • Maps with • Integrated • Photos • Video • Audio • Text • Data (Berry)
3-D Visualization Approaches (Mega-Trend #4) Image Draping-- is an established technique in GIS. Draping a topographic or thematic map onto a 3-D terrain surface is effective but relies on abstract colors, shading and symbols. “Map Abstraction” SportsTracker (MapTrek, 1998) (Berry)
Landscape Visualization (3D Object Rendering) “Laying the Carpet” Step 1) 3-D Terrain Surface Step 2) Polygon Containers Step 3) Surface Texture Step 4) Tree Objects Step 5) Final Composition Step 6) Atmospheric Effects “Pouring the Trees” (See Beyond Mapping III, “Topic 12”, Landscape Visualization, www.innovativegis.com/basis) (Berry)
Visualizing Landscape Impacts (Water retention cut) Virtual Forest (Innovative GIS Solutions, 1998) (Berry)
Visualizing Landscape Conditions Before Fire After Fire Winter Summer (diseased) Virtual Forest (Innovative GIS Solutions, 1998) …changing the landscape’s carpet and objects to simulate different conditions— TODAY there is a big difference… …modern Rendered Scenes approach photographic realism 3D Objects World Construction Set (3D Nature, 2007) Virtual Forest (Innovative GIS Solutions, 1998) Forest inventory data establishes tree types, stocking density and maturity— After Snowfall (ski run) …replaces “old pastel colors and abstract symbols” (Berry)
Recall that in the beginning we had… Computer Mappingautomates the cartographic process (70s) Spatial Database Managementlinks computer mapping with database capabilities (80s) Mapping and Geo-query Map Analysisrepresentation of relationships within and among mapped data (90s) • Spatial Analysis (Contextual) • Spatial Statistics (Numerical) Blow you away Multimedia Mappingfull integration of GIS, Internet and visualization technologies (00s) • Map Delivery/Devices • Map Display • Geospatial Multimedia • Virtual Reality Map-ematics Future Directions Where are we headed? (Berry)
Future Directions(2010 and beyond) Revisit Analytics (2020s) Multimedia Mapping (2000s) Revisit Geo-reference (2010s) GIS Modeling(1990s) Spatial dB Mgt(1980s) Mapping focus Computer Mapping (1970s) Data/Structure focus Analysis focus Future Directions Contemporary GIS The Early Years (See Beyond Mapping III, “Topic 27”, GIS Evolution and Future Trends, www.innovativegis.com/basis) (Berry)
Dominant Driving Forces (three game changers) • Alternative Geographic Referencing (3D GIS) — our current “rectangular-based” coordinate system will be replaced by a 3-dimensional coordinate system of columns (X), rows (Y), and verticals (Z) defining an imaginary matrix of grid elements …but this is going to take a bit more explanation, after we consider the other two driving forces later • Universal Spatial Key — use of the new referencing system to automatically join all databases by serving as a “spatially-enabled” Universal Key(Implicit Spatial Topology) …sort of like a three-dimensional UTM grid cell (1 m2) • Boutique to Big Box— a continued movement of GIS from a “boutique discipline” to increased mainstream use and subsequent redefinition of What GIS Is and Industry Leaders CAD, dBase and Visualization Industries GIS Industry Tomorrow Today …etc. …etc. (Berry)
Geographic Referencing (Traditional 2D GIS) • Vector • Discrete Spatial Objects (vector) — • Point (X,Y) as fundamental unit • Points, Lines , Areas • Raster • Continuous Surfaces (grid)— • Cell (Col,Row) as fundamental unit • Points, Lines , Areas • Surfaces … intersection with a mathematically inferred spheroid/ellipsoid/geoid/datum establishes the Height (Z) from the center of the earth to any point on the earth’s surface` …flatten a 3D referencing system to a 2D projection Cartesian Coordinate System(X, Y, and Z)— both the traditional 2-D map and virtual reality’s 3-D visualization view the earth as a surface— …flattened to a pancake or curved and wrinkled a bit to reflect the surficial topography of an area (Berry)
Alternative Grid Elements (Hexagon and Dodecahedral) Tightly Clustered Groupings Continuously Nested Grid Elements Hexagonal Grid (6 facets) Dodecahedral Grid (12 facets) Consistent distances and adjacency to surrounding grid elements Hexagon Dodecahedral Inconsistent distances and adjacency to surrounding grid elements (Orthogonal and Diagonal) Square Grid (8 facets) Cubic Grid (26 facets) Square Cube 2D Grid Element (Planimetric) 3D Grid Element (Volumetric) (Berry)
Where Have We Been 1) What GIS Is …and Is Not Slides 2-3 2) Nature of Grid-based Mapped Data Slides 4-7 3) Map Analysis and Modeling Slides 9-16 4) Multimedia Mapping Slides 18-24 5) Where Is GIS Headed Slides 4-7 PowerPoint posted at www.innovativegis.com/basis/Present/Oslo2010/Oslo_Sep2010.ppt (Berry)
Opportunities to Go Farther www.innovativegis.com/basis ... online papers, materials, books and software Beyond Mapping an online book (free) Map Analysis a self-instructional book and Software for hands-on exercises (US$45.00 plus S/H) PowerPoint posted at … www.innovativegis.com/basis/Present/Oslo2010/Oslo_Sep2010.ppt Email: jberry@innovativegis.com