Download
1 / 16
160 likes | 175 Vues
This workshop presentation discusses satellite-derived global scale biomass burning products and land cover using various EO systems. It showcases the existing and under development fire products, land cover products, and intercomparisons of global fire products.

E N D
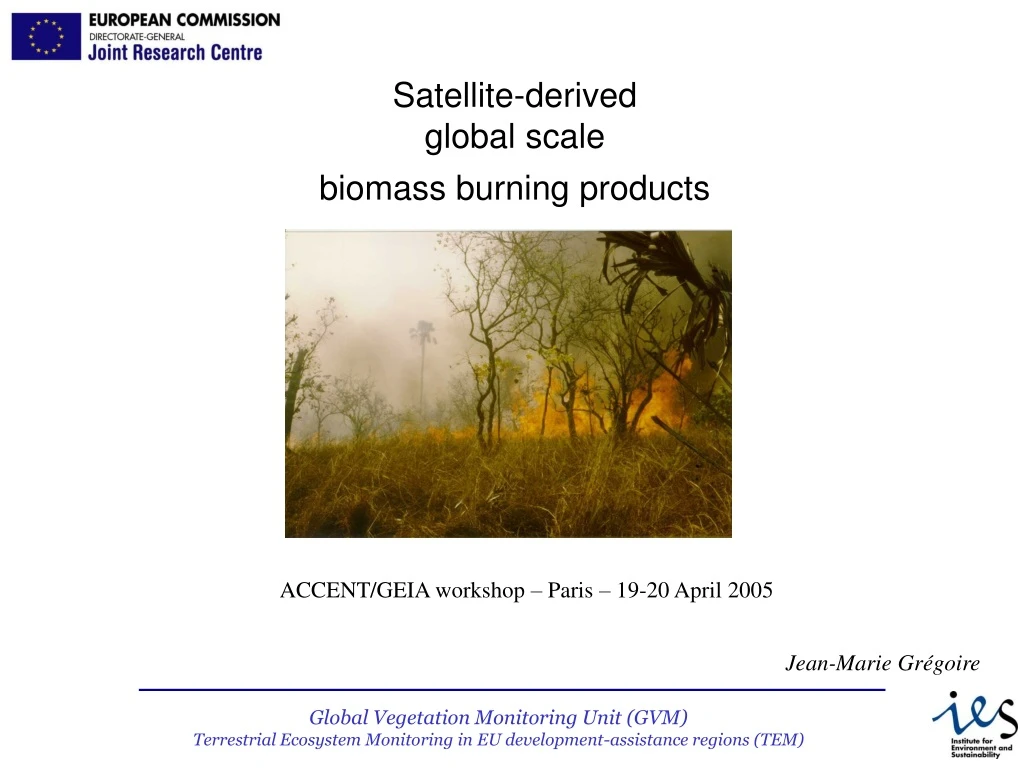
Jean-Marie Grégoire Satellite-derivedglobal scalebiomass burning products ACCENT/GEIA workshop – Paris – 19-20 April 2005
Helicopter view - Australia SPOT-VGT 1 km resolution – RCA Sudan border - ~ 500 km x 500 km
Northern Australia June 1999 NOAA-AVHRR ( ~ 2 pm ) SPOT-VEGETATION ( ~ 10 am )
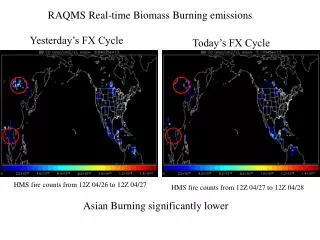
2 Nov. 1999 7 Nov. 1999 12 Nov. 1999 SPOT-VGT ; Sudan ; Sud Darfour (Buram) ; ~ 400x400 km
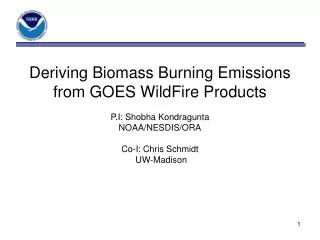
Global scale fire products derived from EO systems Existing Under development Active Fires (“hot spots”) • IGBP-JRC Global Fire Product (GFP) • ESA World Fire Atlas (WFA) • TRMM • NASA MODIS Active Fire Burnt Areas • JRC et al., Global Burnt Area 2000 (GBA2000) • ESA GLOBSCAR Active Fires (“hot spots”) • ESA et al., GLOBCARBON Burnt Areas • JRC et al., VGT4Africa • JRC et al., GEOLAND
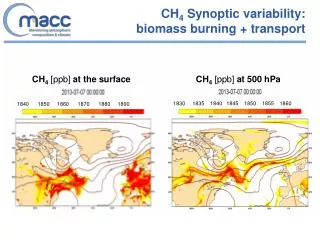
Densité des feux dans la zone inter-tropicale durant l’année 1998 source: TRMM ((Tropical Rainfall Mapping Mission)
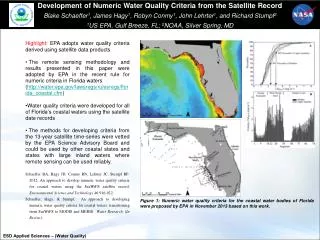
Area burnt globally in 2000 and seasonal distribution: the GBA2000 product source: Tansey et al., 2004, Climatic Change, 67
Inter-comparison of • global fire products: • World Fire Atlas (WFA) • GLOBSCAR • GBA2000 Boschetti et al., 2004 Geophy. Res. Letters Vol. 31
Total annual burned area estimated at 3.5 million km2 > 600,000 burn scars detected
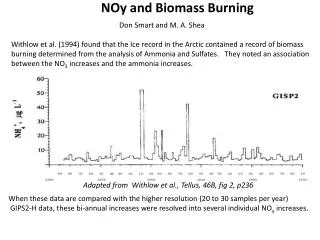
Seasonal distribution of burning activity in Africa for the Year 2000 Total annual burned area estimated at 2.6 million km2 > 300,000 burn scars detected
Global scale land cover products derived from EO systems Existing Under development Land cover • IGBP-DIS … • University of Maryland … • JRC et al., Global Land Cover 2000 (GLC2000) Land cover • ESA et al., GLOBCOVER-v1 • JRC-ESA, GLOBCOVER-v2 • NASA MODIS
“pixels” burnt per vegetation type Area burnt per vegetation type: ha Fuel: T. ha-1 ???? M (…) = Area . Biomass . Burning efficiency. Emission factor Globe: ~ 400 millions hectaresburnt in 2000 Med. Basin: ~ 500000 hectares Woodland & forests ~ 1600 g CO2 / kg biomass Grasslands ~ 1700 g CO2 / kg biomass Dry tropical grass savanna: ~ 2 tons/hectare Moist tropical savanna: ~ 10 tons/hectare Boreal forest: ~ 20 tons/hectare Moist tropical forest: ~ 40 tons/hectare ~ 25% forest -- ~ 80% savanna