Download
1 / 26
260 likes | 414 Vues
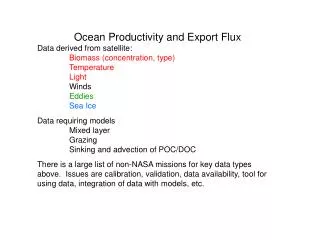
Ocean Productivity and Export Flux Data derived from satellite: Biomass (concentration, type) Temperature Light Winds Eddies Sea Ice Data requiring models Mixed layer Grazing Sinking and advection of POC/DOC

E N D
Ocean Productivity and Export Flux Data derived from satellite: Biomass (concentration, type) Temperature Light Winds Eddies Sea Ice Data requiring models Mixed layer Grazing Sinking and advection of POC/DOC There is a large list of non-NASA missions for key data types above. Issues are calibration, validation, data availability, tool for using data, integration of data with models, etc.
Drake Passage: Ice concentration vs Chl-a Ice measured by SSM/I-F13 Bootstraps algorithm, Chl: SPGANT using SeaWiFS Ice concentration is mean for squares 1-3 (next slide), Chl-SPGANT is mean for squares 1-4 (next slide)
4 3 2 1
High Resolution AMSR-E 89 GHz Sea Ice • http://iup.physik.uni-bremen.de/iuppage/psa/2001/amsrop.html • Daily sea ice maps are provided by a small group at University of Bremen using data from JAXAs AMSR-E sensor on NASA's Aqua Satellite (since May, 2002) . • The main problem is data access and usability: • NSIDC may have all the best data but it is hard to find. • The differences between NASA group and the bootstraps algorithms are confusing • The University of Bremen group provides easy to use HDF data of a single variable: ice concentration. • The NSIDC AMSR-E datasets have 64 (!) different products, including ice concentration but at lower spatial resolution.
1. Mission Concept of GCOM and SGLI • 1.1 Mission target • Global Climate Observation Mission (GCOM) GCOM-W (water) satellite series #1~3 (Jan. 2012~, 13 years) Sensor: AMSR-2 which is a follow-on sensor of AMSR-E on Aqua GCOM-C (climate) satellite series #1~3 (early 2014 (TBD) ~, 13 years) Sensor: Second-generation Global Imager (SGLI) which is a radiometer of 380-12000nm, 250m-1km resolution, and 1150-1400km swath, as a follow-on mission of ADEOS-II/GLI. • Targets of GCOM-C are followings. • Establishment of long-term observation system for the global carbon cycle and radiation budget • Integrated use withother earth observation systems • Contribution to numerical climate models (driving force, outputs comparison, and parameter tuning) • Contribution to operational use (weather forecast, monitoring of meteorological disaster, fishery..) • Enhancement of new satellite data usability
Cloud properties Sea surface Temp. Snow Ice distribution Cloud liquid water Sea surface Temp. Sea ice concentration 2. GCOM-C products and SGLI design - 2.1 mission target and product groups GCOM-C observation targets Radiation budget Carbon cycle Atmosphere Cloud and aerosol changes and Ratiative forcing Ocean Carbon and heat pool and coastal environment Cryosphere Ice-albedo feedback in global warming Land Carbon cycle and vegetation production Snow surface properties Aerosol properties Snow surface Temp. Land surface Temp. Land cover Above- ground biomass Ocean color Vegetation production Water vapor Precipi- tation Snow depth Soil moisture Sea surface wind Major observation targets of GCOM GCOM-W Water cycle change observation satellite
2. GCOM-C products and SGLI design - 2.5 GCOM-C products and SGLI channels IRS channels VNR channels Blue Green Red Yellow Specifications of SGLI, such as center wavelengths, band width, SNR, and dynamic range, are designed in consideration of retrieval algorithms of the observation targets.
2. GCOM-C products and SGLI design - 2.7 GCOM-C/SGLI design radiation budget & primary production shortwave & thermal InfraRed (T) Scanner (IRS) Polarization (along-track slant) radiometer (P) • Targets are carbon cycle and radiation budget relating to the global environmental change. • SGLI’ll observe aerosols, cloud, vegetation, ocean color, sea/land surface temperature, snow/ice, and so on for more than 13 years. • The SGLI features are finer spatial resolution (250m (VNI) and 500m (T)) and polarization/along-track slant view channels (P), which will improve land, coastal, and aerosol observations. Visible & Near infrared push-broom Radiometer (VNR) SGLI : Second generation GLobal Imager Multi-angle obs. for 670nm and 865nm
3. Examples of expected GCOM-C product - 3.4 VNR 250m land and coastal observation 250m Ocean color chlorophyll-a and NDVI simulated using GLI 250m channels (a) GLI 1km Osaka Bay (1 Oct. 2003, CHL by LCI) (b) GLI 250m Osaka Bay (1 Oct. 2003, CHL by LCI) SGLI 250m resolution will enable to detect more fine structure in the coastal area such as river outflow, regional blooms, and small current. Hiroshi Murakami, Mitsuhiro Toratani and Hajime Fukushima,Satellite ocean color observation with 250 m spatial resolution using ADEOS-II GLI, Remote Sensing of the Marine Environment, Proceedings of SPIE, Volume 6406-05, Nov. 28, 2006
4. GCOM-C Project Timeline- 4.1 GCOM-C algorithm development and validation schedule (TBD) TBD TBD PFM BBM EM • Evaluate & improve candidate algorithm performance (theoretical performance + processing stability) • Obtain in-situ data, develop and validate algorithms, and examine applications • Pre-launch algorithm implementation-1 (PLI-1) for checking the algorithm theoretical performance and satellite data applicability based on the above results. • Correspond to the satellite sensor design and performance tests. • Examination of the implementability of new algorithms, and improvement of the existing algorithms • Develop using other satellite or in-situ observations • Correspond to the sensor design results. • Intensive verification and improvement for Ver.1 data release as an initial validation phase for about one year after the launch • Validate and improve (version up) algorithms using SGLI observation data • Obtain in-situ data required for algorithm development, validation and improvement • develop and validate research/new algorithms, and develop new usage of the products • Based on the PLI-1 results, improve the at-launch version of operational codes • Pre-launch implementation-2 (PLI-2) for checking flow and performance of the real processing
4. GCOM-C Project Timeline- 4.2 GCOM-C calibration schedule (TBD) TBD TBD PFM BBM EM • Improve and keep the accuracy of long-term data by continuing (1)~(5) and applying their results to the processing algorithm. • Reflect sensor characterization and calibration results to the following GCOM-C#. • Post-launch calibration • (1) Radiometric calibration, • (2) Sensor characterization and image quality evaluation, • (3) vicarious/cross calibration, • (4) Moon calibration, and • (5) geometric calibration • Improve and keep the accuracy of level-1 products by applying the calibration results to the processing algorithm. • Investigate influence and correction methods of sensor design characteristics • Reflect the results to the radiometric and geometric sensor models developed in the BBM phase. • Investigate influence and correction methods of manufactured sensor characteristics in EM and PFM • Reflect the results to Level-1 algorithm and calibration coefficient tables which are used for the at-launch processing
Geostationary Ocean Color Imager (GOCI) in KOREA - is scheduled to be launched onboard Communication Ocean & Meteorological Satellite (COMS) in June 2009. – Detecting short term biophysical phenomena requires high frequency observation. – Conventional PO satellite hardly observe the ocean color with high frequency. – Reducing cloud problem in OC sensor. * The altitude of GEO satellite is 35,786km * Polar sun synchronous orbit : ~780km Courtesy of Ahn (2008), report to IOCCG 13th meeting
GCOI Technical Specification Courtesy of Ahn (2008), report to IOCCG 13th meeting
GCOI Technical Specification Courtesy of Ahn (2008), report to IOCCG 13th meeting
India OCEANSAT-2 Launch planned late 2008 Courtesy of Navalgund (2008) report to 13th IOCCG meeting
Future Satellite Mission Timelines* Mark R. Drinkwater European Space Agency Earth Observation Programmes *See last slides for modification record
00 01 02 03 04 05 06 07 08 09 10 11 14 12 13 Ocean Surface Topography Medium accuracy (SSH) from high-inclination orbit GFO ICESAT RA/ERS-2 SRAL/GMES S-3A RA-2/Envisat CRYOSAT-2/LRM AltiKa/OceanSat-3 Alt/HY-2A Alt/HY-2B High accuracy (SSH) from mid-inclination orbit TOPEX/POSEIDON Jason-1 OSTM/Jason-2 OSTM/Jason-3 In orbit Approved Planned/Pending approval
00 01 02 03 04 05 06 07 08 09 10 11 14 12 13 IPY GODAE Geoid and Salinity Missions Gravity/Geoid missions (for absolute circulation) CHAMP GRACE GOCE Salinity SMOS AQUARIUS In orbit Approved Planned/Pending approval
00 01 02 03 04 05 06 07 08 09 10 11 12 14 13 IPY Ocean Winds Scalar Wind SSMI/DMSP SSMI/DMSP AMSR-E/EOS-Aqua AMSR2/GCOM-W1 Vector Wind WINDSAT AMI/ERS ASCAT/METOP-A,B,C Seawinds/QuikSCAT Ku-Scat/Oceansat-2 Seawinds/ADEOS-2 Ku-Scat/HY-2A GODAE In orbit Approved Planned/Pending approval
00 01 02 03 04 05 06 07 08 09 10 11 12 14 13 GODAE IPY SAR for Oil pollution, sea ice and sea-state GMES S-1A AMI/ERS ASAR/Envisat C-band RADARSAT-3 RADARSAT-1 C-band RADARSAT-2 C-band PALSAR/ALOS L-band COSMO-SKYMED X-band TERRASAR-X X-band C-, X-band/HY-3 In orbit Approved Planned/Pending approval
00 01 02 03 04 05 06 07 08 09 10 11 12 14 13 GODAE WindSat MODIS/EOS-Terra Sea Ice (Concentration, Extent, Drift, Thickness) GMES S-1 AMI/ERS ASAR/Envisat C-band Drift RADARSAT-3 RADARSAT-1 C-band RADARSAT-2 C-band PALSAR/ALOS L-band COSMO-SKYMED X-band Seawinds/QuikSCAT TERRASAR-X X-band ICESAT-2 ICESAT Thickness CRYOSAT-2 SRAL/GMES S-3A MODIS & AMSR-E/EOS-Aqua SMOS Rad/HY-2A COCTS/HY-1A COCTS/HY-1B Concentration OLS & SSMI/DMSP—AVHRR & AMSU/NOAA AMSR2/GCOM-W1 IPY NPOESS C1 VIIRS/NPP In orbit Approved Planned/Pending approval
00 01 02 03 04 05 06 07 08 09 10 11 12 14 13 Seawinds/QuikSCAT MODIS/EOS-Terra Ice Sheets (Accum, Melt, Dynamics, Thickness; Mass Variability) ASAR/Envisat C-band AMI/ERS GMES S-1 RADARSAT-3 RADARSAT-1 C-band RADARSAT-2 C-band Dynamics/ Mass Flux PALSAR/ALOS L-band COSMO-SKYMED X band TERRASAR X band ICESAT ICESAT-2 Altimetry/ Gravity GRACE CRYOSAT-2 SRAL/GMES S-3A GOCE IPY Ku-Scat/Oceansat-2 Albedo/Accum/Melt MODIS & AMSR-E/EOS-Aqua AMSR/GCOM-W1 OLS & SSMI/DMSP—AVHRR & AMSU/NOAA VIIRS/NPP NPOESS C1
00 01 02 03 04 05 06 07 08 09 10 11 14 12 13 GODAE Sea & Ice Surface Temperature FY-1C FY-1D FY-3A, B,.. (VIRR/MODI) Optical CBERS-2 CBERS-2B CBERS-3 CBERS-4 AVHRR/NOAA am orbit AVHRR/METOP-A,B,C am orbit AVHRR/NOAA pm orbit **Geostationary sats: GOES, MSG contribute - but not shown SLST/GMES S-3A ATSR/ERS-2 AATSR/ENVISAT VIIRS/NPP am NPOESS C1 MODIS/EOS-Terra/10:30 MODIS & AMSR-E/EOS-Aqua SGLI/GCOM-C1 MOS/IRS-P3 HY-1B HY-1 Microwave IPY ADEOS-2 AMSR/GCOM-W1 TMI/TRMM WINDSAT Rad/HY-2A MSMR/Oceansat-1 In orbit Approved Planned/Pending approval
00 01 02 03 04 05 06 07 08 09 10 11 12 14 13 GODAE Ocean Colour FY-3A, B,.. (VIRR/MODI) FY-1C FY-1D COCTS/HY-1 COTS/HY-1B AVHRR/NOAA am orbit OCM/IRS-P4/Oceansat-1 OCM-2/Oceansat-2 MOS/IRS-P3 OLC/GMES S-3A MERIS/ENVISAT AVNIR-2/ALOS ADEOS-2 SGLI/GCOM-C1 PARASOL-POLDER IPY MODIS/EOS-Terra/10:30 MODIS/EOS-Aqua VIIRS/NPP am NPOESS C1 SeaWiFS/SEASTAR In orbit Approved Planned/Pending approval