Productivity Concept, Measurement and Improvement
1.81k likes | 2.19k Vues
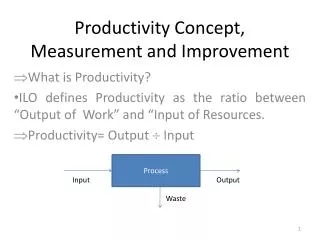
Productivity Concept, Measurement and Improvement. What is Productivity? ILO defines Productivity as the ratio between “Output of Work” and “Input of Resources. Productivity= Output Input. Process. Input. Output. Waste.

Productivity Concept, Measurement and Improvement
E N D
Presentation Transcript
Productivity Concept, Measurement and Improvement What is Productivity? ILO defines Productivity as the ratio between “Output of Work” and “Input of Resources. Productivity= Output Input Process Input Output Waste
This definition applies to an enterprise, an industry or an economy as a whole. • Productivity is simply the ratio between the amount produced and amount of resources used in the course of production. • These resources can be: (Unit of resources is in brackets.) • Land (Hectares) • Material (Metric Tonne) • Plant and Machinery (Machine Hours) • People (Man Hour) • Capital (Rupees)
Productivity Improvement To enhance productivity ,reduce cost, eliminate waste …… Deals with man machine systems…… Consists of : –selection of tools and techniques. - development of time standards - installation of wage incentives - value engineering,value analysis - project feasibility studies
Fedrick Taylor – father of industrial engineering • Henry .L.Gantt - measurement of results – Gantt chart, incentive plans.
Productivity • Productivity is Output (within a defined time and good quality) Input Factors influencing productivity • Controllable or Internal factors • Non controllable or external factors.
Partial productivity Partial productivity is defined as the ratio of output to any one class of input i.e either material, capital, labour or energy Labour productivity = Output Labour hours
Total productivity • Total productivity is defined as the ratio of total output to the sum of all input factors. • = Total output Total input Total input = Labour+ Material + Capital + Energy + Other expenses Converted to a common measurable factor
Controllable or Internal factors • Product – extent to which it meets requirements. • Plant and equipment – availability and reduction of idle time. • Technology – automation. • Material and Energy - reduce material and energy consumption. • Human factors – motivation and training. • Work methods – improvement in the way of doing things. • Management style – communication, policy and procedures.
Non controllable or external factors. • Natural resources – manpower, land and raw materials • Government and infrastructure – government policies ,transport, power, fiscal policies.
Is Productivity different from Performance? • Productivity takes into account output in relation to input. • Performance takes into account output only. • Productivity =Output÷ Input • In performance, we consider only the output and not the input. • A performance index becomes comparison of actual output with some standard or expected output. • Performance Index = Actual work done÷ Ideal or standard expected work.
Example: It takes 3 Mtrs. cloth to make a coat. In a day a person is expected to make 50 coats. He makes 40 coats from 111 Mtrs. Of cloth. • What is his Performance ? • 40 coats • Performance Index ? • {40 ÷ 50} x100= 80% • What is his cloth productivity index?
Normally he should have used 120 Mtrs. cloth. However he managed to make 40 coats in 111 Mtrs. • Cloth Productivity Index = {120÷ 111} x 100= 108%
Improving Productivity • Needs to be organisation’s focus area: • Need a vision, mission and periodic goals for measurement and improvement of productivity • Customer Orientation – strategy to provide same quality of service at lower cost or better service at same cost • Empowerment of workers and staff • Encourage creativity • Right people for right jobs • Use of right techniques
Improving Productivity • In the areas of product and process improvement: Value Analysis helps in eliminating non-value adding function i.e. functions resulting in low performance at high costs from products and processes. • On the technology front, extremely precise and accurate high-speed machines and systems like ERP, CAD, CAM, CIM etc have drastically reduced the processing time. • On the human front, incentive plans, job enrichment, fringe benefits etc are used to encourage value-adding inputs from people.
Improving Productivity • Inventory control, material handling systems etc. reduce the time, space, effort and money involved in making material available for its time and place utility. • Techniques like work-study, ergonomics, etc eliminate motions that are non-productive or make them easy to perform are included in the human factor. • Today, Lean Production System approach is a holistic one, which covers all areas of productivity improvement.
Improving Productivity Few other techniques like JIT, TPM, TQC, KAIZEN, Quality Circles can be applied simultaneously. Summary A. Technology Based • CAD, CAM, Integrated CAM, Robotics, Laser Beam Technology, Energy Technology, Group Technology, Computer Graphics, Simulation, Maintenance Management, Rebuilding Old Machinery, Energy Conservation.
Improving Productivity Employee Based • Financial Incentives, Group Incentives, Fringe Benefits, Promotions, Job Enrichment, Job Enlargement, Job Rotation, Worker Participation, MBO, Skill Enhancement, Learning Curve, Working Condition Improvement, Communication, Zero Defects, Punishment, Recognition, Quality Circles, Training, Education, Role Perception, Supervision Quality.
Where to Begin • Benchmarking – internal and external
KPIs – Monitoring and Control Process Strategic KPIs Top Management Tactical KPIs Country Management and Departmental Heads Lgs M&S M&S / Fin Operational KPIs Operational Managers M&S Lgs
Strategic and Operations KPI’s for OpCo’s STRATEGIC MARKETDESCRIPTION Corporate OpCo COMMERCIAL OPERATIONS Commercial Indicators on following slides
Strategic KPIs EBIDTA % 1 Customer Satisfaction Index 9 2 %increase in volume committed through contracts per quarter (Transformational Sales) % Increase in Gross Margin through Improvement Initiatives 8 Total Delivered Cost per Ton 3 Strategic KPIs Ratio of sales through transformational channels to sales through transactional channels 7 No. of FTEs in Out Bound Logistics per 1,000 Tons 4 Cement Dispatched per Day in Tons No. of FTE in Sales per 1,000 Tons 6 5
Tactical KPIs – Marketing & Sales (1/2) Time required to convert enquiry to contract 1 6 2 Return on Investment for installing silos at customer site % volume committed through contract (Transformational Sales) Marketing & Sales Percentage of prospects converted as customers (Hit Ratio) Number of prospects lost to competitors per quarter 5 3 % Variance of Annual Sales Plan 4
Tactical KPIs – Marketing & Sales (2/2) O2C Final Presentation Marketing and Sales Expenses in % of net sales (%) 7 % Success of sales strategy Cement Dispatched per day in Tons 13 8 Additional cost incurred due to swap sales 12 Marketing & Sales % Increase in market share due to customer service events 11 % Improvement in CSI index 12 9 % Increase in market share due to customer service events 10
O2C Final Presentation Tactical KPIs Marketing & Sales / Finance EBIDTA (%) 1 Reduction in number of cases for overdue payments in a quarter No of cases rejected in credit check in a quarter 6 2 Marketing & Sales / Finance 5 % Deviations in complying to credit assessment guidelines in a year Days sales outstanding Aging Analysis of Accounts Receivables 3 Operating Profit Margin (%) 4
Tactical KPIs – Logistics (1/2) O2C Final Presentation Order Fulfillment Cycle Time 1 Distribution Costs per Ton Order Management Costs 7 2 Logistics 6 % Forecast accuracy of annual dispatch plan at disaggregated level Performance related to On Time Delivery for Export Orders (Performance measured from committed date to loading of Ship) % compliance of 3PL against SLAs 5 3 % Success rate with 3PL Prospects per year (% Logistics Contractors graduated to level of 3PL) 4
Tactical KPIs – Logistics (2/2) O2C Final Presentation % Reduction in Total Logistics Cost per year 8 % Variance of volumes from budget % Improvement in On Time Delivery per Year 13 9 Logistics % Variance of logistics costs from budget % Capacity Utilization of logistics infrastructure 12 10 Total Cost saved due to Cross-Docking in a year 11
O2C Final Presentation Operational KPIs – Marketing & Sales (1/3) Time required to process the enquiry: Time from the receipt of enquires to submission of quotation 1 No. of orders handled with exceptions % Compliance to process enquiries on time 6 2 Marketing & Sales Receive, enter & validate order cycle time No. of Credit / Debit Notes issued per month 5 3 % increase in number of transformational customers 4
Operational KPIs – Marketing & Sales (2/3) O2C Final Presentation Average Cost to Receive, Enter & Validate Order 7 % customer needs represented in list of customer service events Average time required to capture customer order through customer care centre 12 8 Marketing & Sales Number of cases where payment dishonoured in a quarter % orders captured through webSALES in a year 11 9 Average time required to create / amend Customer related masters 10
Operational KPIs – Marketing & Sales (3/3) O2C Final Presentation No of innovative customer service events identified per year 13 Promotional Expenses per Region/ Sales Unit per Quarter No. of changes done to Customer Service Calendar per year 19 14 Marketing & Sales 15 Number of enquiries received per quarter per Key account manager Number of orders swapped/diverted per Quarter Average Time required from receipt to resolution of Customer Complaints 18 16 % Reduction in number of complaints per 1,000 tons 17
Operational KPIs – Logistics (1/3) O2C Final Presentation Average time required for arranging the vehicle for delivery of Customer Order 1 Average time taken for loading 1,000 tons for Exports from plant to ship % Fill Rate: The percentage of ship-from-stock orders shipped within 24 hours of order receipt 6 2 Logistics Loading Cycle Time: Average tonnage loaded per hour of a product % compliance to Stock Transfer Plan 5 3 Average Gate In to Gate Out Cycle time 4
O2C Final Presentation Operational KPIs – Logistics (2/3) Average Waiting time in lorry yard per lorry 7 Demurrage / Wharfrage paid per Quarter for domestic and exports Average total inventory tonnage per month of cement at various stock points 12 8 Logistics Total Time required for preparation and completion of Annual Dispatch Plan Cost to Package 11 9 Average time taken for un-loading the ships / barge/ trucks in case of Stock Transfers 10
Operational KPIs – Logistics (3/3) O2C Final Presentation Average time between product delivery and receipt of POD at the point of dispatch 13 % Tonnage utilised for backhauling operations (ratio of dispatches to a region/ backhauling) ## Cost to Invoice 17 14 Logistics % orders fulfilled on the committed date Number of stock outs per stock point per quarter 16 15 ## This KPI ownership varies from company to company
Partial Productivity Definition • Ratio of output to one class of input. • At a given time it considers only one input and ignores all other inputs. • Its significance lies in its focus on utilization of one resource. • For instance, labour productivity is measured using utilization of labour hours; whereas capital productivity is measured in Rupees.
Case: • As a part of new assignment, Manager of Pop-Corn Products was asked to identify areas for productivity improvements. He collected data on all inputs and outputs of previous year’s operations being transferred into equivalent of money units. The table below gives details with all figures in lakh of rupees. Parag plans to calculate values of partial productivity to aid in his study. Please help him in his endevour.
Solution: • Partial productivity of various inputs is as follows: • Human productivity= 1000÷300= 3.3 • Material Productivity= 1000÷200=5.0 • Capital Productivity= 1000÷ 300 =3.3 • Energy Productivity= 1000÷ 100= 10.0 • Productivity of other expenses= 1000÷50=20.0
Total Factor Productivity • In an effort to improve productivity of labour, company may install more machinery. • Then productivity of labour will go up bringing down the capital productivity. • Partial productivity that typically uses only one resource at a time fails to grasp this paradox. • Historically labour and capital were considered to be the most significant in contribution in the process of production.
Total Factor Productivity model developed by John W. Kendrick in 1951, has taken only labour and capital as only two input factors. → For instance, Products worth Rs 100 lakhs were manufactured and sold in a month. It consumed Rs 20 lakhs worth labour hours and Rs 55 lakhs worth capital. - The Factor Productivity = 100÷ (20+55)= 1.33
Multi-factor Model of Productivity • Developed by Scott D. Sink Multi-factor Productivity Measurement Model considered Labour, Material and Energy as major inputs. • Capital was deliberately left out as it is most difficult to estimate how much capital is being consumed per unit/ time. • The concept of depreciation used by accountants make it further difficult to estimate actual capital being consumed.
Total Productivity Model • Total Productivity Model developed by David J. Sumanth in 1979 considered 5 items as inputs. • These are Men, Material, Money (Capital), Energy and other expenses. • This model can be applied in any manufacturing or service organization. • Total Productivity= Total Tangible Output÷ Total Tangible Input.
American Productivity Centre (APC) Model • American Productivity Centre has been advocating a productivity measure that relates profitability with productivity and price recovery factor. • Profitability= Sales Costs • {Output Quantities x Prices} {Input Quantities x Unit Costs} • Productivity x Price Recovery Factor. • The APC model is different from other models in its treatment, by inclusion of Price Recovery Factor.
What is price recovery factor? • It is a factor that captures the effect of inflation. • The changes in this factor over time indicate whether changes in input costs are absorbed, passed on, or overcompensated for, in the price of the firm’s output. • Thus inclusion of this factor will show whether gains or losses of a firm are due to changes in productivity or it merely indicates the fluctuations in the prices of material consumed and sold.
ILO Approach to Productivity Improvement • The classic ILO approach is Task Based. • It breaks manufacturing time into basic work content, added work content, and ineffective time. • The main focus is on reducing inefficient time in the total work content. • The Basic Work Content - The amount of work “contained” in a given product or process measured in man-hours or machine hours.
The basic work content is the irreducible minimum time theoretically required to produce one unit of output. B. Added Work Content • Work content added by defects in the design or specification of the product. It may be due to lack of standardization and/or incorrect quality standards. - This additional work content is the time taken over and above the time of the basic work content due to features inherent in the product which could be eliminated.
(2) Work content added by inefficient methods of production or operation. • This is the time taken over and above the basic work content plus (1), due to inefficiencies inherent in the process or method of manufacture or operation. • This includes wrong machine used, processes operated in bad conditions, wrong tools used, bad layout, operator’s bad working methods etc.
C. Ineffective time • All interruptions which cause the worker or machine or both to cease producing or carrying out the operations on which they are supposed to be engaged. • Irrespective of the cause, these must be regarded as ineffective time because no work towards completing the operation in hand is being done during the period of the interruption.
(1) Ineffective time due to shortcomings on the part of the management. • Time during which man or machine or both are idle because management failed to plan, direct, coordinate or control efficiently. (2) Ineffective time within the control of the worker. • Time during which man or machine or both are idle for the reasons within the control of the worker himself.
Focus on reducing added work content & inefficient time in the total work content • Following are the methods by which added work content & inefficient time can be reduced. →By reducing • Poor design and frequent design changes • Waste of materials • Incorrect quality standards • Poor layout and poor utilization of space • Inadequate material handling