Download
1 / 56
580 likes | 713 Vues
This resource delves into the transformations of logarithmic functions, focusing on vertical shifts, horizontal shifts, and reflections. Using the reference point (1, 0) as a guide, we explore how to graph y = log(x) and how the graph shifts according to different values of 'a' and 'b'. The concepts of increasing or decreasing transformations are illustrated, including the effects of scaling factors ('c') on the graph's width and reflection. Clarification on how these transformations affect the appearance of the graph is provided with illustrative examples.

E N D
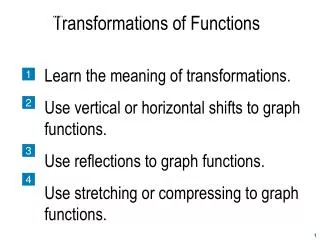
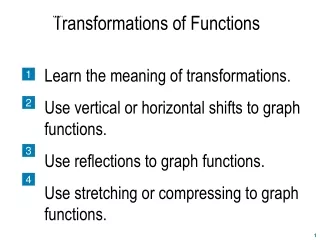
Transformationsof Functions Viviana C. Castellón East Los Angeles College MEnTe Mathematics Enrichment through Technology
Since the log1 = 0, a good reference point when graphing y = logx is (1,0) Notice, when graphing y=logx, the x-intercept is 1
Given the following function, If: a > 0, then shift the graph “a” units up, using the reference point (1,0) If: a < 0, then shift the graph “a” units down, using the reference point (1,0)
Given the following function, Since a > 0, then shift the graph “3” units up, using the reference point (1,0)
Given the following function, We get the expression (x - b) and equal it to zero x - b = 0 x = b If: b> 0, then shift the graph “b” units to the right, using the reference point (1,0) If:b< 0, then shift the graph “b” units to the left, using the reference point (1,0)
Given the following function, x – 1 = 0 x = 1 Since 1> 0, then shift the graph “1” unit right, using the reference point (1,0)
Graphing Recall: Shift “3” units up since 3 > 0 then we use the expression x + 1, and equal it to zero x +1 = 0 x = -1 Since –1 < 0, then we shift “1” unit to the left
Given the following function, For this equation, c determines how wide or thin it will be. if: |c|>1, then the graph is closer to the y-axis if: |c|=1, then the graph remains the same if: 0<|c|<1, then the graph is further from the y-axis if c is a negative number, then the graph will reflect on the x-axis
Given the following function, Since |5| > 0, then the graph is closer to the y-axis
Given the following function, Since 4 > 0, shift the graph “4” units up, using the reference point (1,0) x – 1 = 0 x = 1 Since 1> 0, then shift the graph “1” unit to the right, using the reference point (1,0). Since |5| > 0 shift the graph closer to the y-axis.