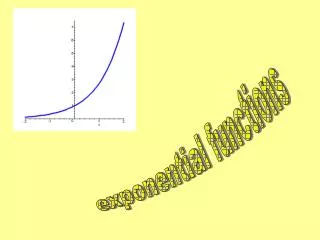
TRANSFORMATIONS OF EXPONENTIAL FUNCTIONS
Chapter 2 Exponents and Logarithms. TRANSFORMATIONS OF EXPONENTIAL FUNCTIONS. 2.2. 2.2. 1. MATHPOWER TM 12, WESTERN EDITION. Learning Outcomes:. Learn to apply translations, stretches, and reflections to the graphs of exponential functions
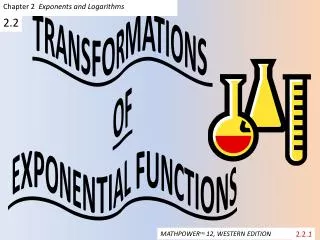

TRANSFORMATIONS OF EXPONENTIAL FUNCTIONS
E N D
Presentation Transcript
Chapter 2 Exponents and Logarithms TRANSFORMATIONS OF EXPONENTIAL FUNCTIONS 2.2 2.2.1 MATHPOWERTM 12, WESTERN EDITION
Learning Outcomes: • Learn to apply translations, stretches, and reflections to the graphs of exponential functions • To represent the transformations in the equations of exponential functions • To solve problems that involve exponential growth or decay
Consider an exponential function of the form: • 1. Graph each set of functions on one set of coordinate axes. 2. Compare the graphs in set A. For any constant k, describe the relationship between the graphs of and .
continued 3. Compare the graphs in set B. For any constant h, describe the relationship between the graphs of and .
Investigate Further: 4. Graph each set of functions on one set of coordinate axes.
5. Compare the graphs in set C. For any real value a, describe the relationship between the graphs of and . 6. Compare the graphs in set D. For any real value b, describe the relationship between the graphs and .
The graph of a function of the form is obtained by applying transformations to the graph of the base function , where c > 0. (see text p. 348)
Example: Transform the graph to Describe the effects on the domain, range, equation of the horizontal asymptote, and intercepts. Solution Vertical: no vertical stretch but the graph is translated 3 units down This affects the asymptote: y = 0 becomes y = -3 so the range becomes y > -3 Horizontal: Graph is reflected in the y - axis and is stretched by a factor of ½ , then translated 5 units left. The domain is not affected.
Solution continued: Intercepts • To determine the intercepts after multiple transformations, solve algebraically by setting x = 0 to solve for y and y = 0 to solve for x.
Example: • A cup of water is heated to 100˚C and then allowed to cool in a room with an air temperature of 20˚C. The temperature, T, in degrees Celsius, is measured every minute as a function of time, m, in minutes, and these points are plotted on a coordinate grid. The temperature of the water is found to decrease exponentially at a rate of 25% every 5 min. A smooth curve is drawn through the points, resulting in the graph to the right.
a. What is the transformed exponential function in the form that can be used to represent the situation? (decreases by 25%, which means 75% of previous value) The exponent m represents any time. The exponent needs to be because the five represents 5 minute intervals (decreases by 25% every 5 minutes) There is a horizontal asymptote at T = 20, therefore the function has been vertically translated upward 20 units.
Solution continued • The y-intercept occurs at (0, 100). So, there must be a vertical stretch factor. Solve for a:
Assignment: • P. 355 #3a,c, 4, 5, 7b,c, 9, 11, C1