Five Years After Launch: Evaluating the Progress of Statistics Explained at UNECE
100 likes | 244 Vues
This session at the UNECE Work Session on the Communication of Statistics (June 18-20, 2014) reflects on the growth and development of the Statistics Explained platform. With user engagement metrics highlighting 800 articles and 1800 glossary items as of May 2014, the platform has significantly expanded since 2009. The multilingual approach, incorporating French, German, Spanish, and Russian, along with a flexible dashboard, enhances accessibility. This review emphasizes the importance of coherence, integration, and the continuous improvement of statistical communication.

Five Years After Launch: Evaluating the Progress of Statistics Explained at UNECE
E N D
Presentation Transcript
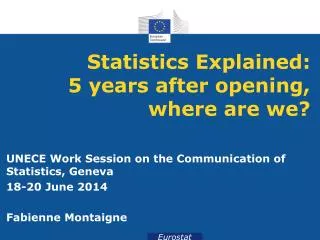
Statistics Explained:5 years after opening, where are we? UNECE Work Session on the Communication of Statistics, Geneva 18-20 June 2014 Fabienne Montaigne
Users' visits : some figures (1/2) 10 most accessed pages in 1st trimester 2014
Growing structure • May 2009: 160 stat.articles + 900 glossary items May 2014: 800 articles + 1800 glossary items (stat., background, theme introduction) • Coherence, integration, harmonisation • Articles structured, grouped through: • Category pages • Online publications • Rules for names and titles • SE articles = source for creating new publications
Several languages • Multilingual Mediawiki plugin • Page by page connected language versions • Since May 2010: French & German (now about 100 articles) and 20 articles in 20 languages, updated yearly • Additional articles in Spanish and Russian • Quality guaranteed through DGT & model pages • Technical constraint: English page should exist • Glossary expanding in several EU languages
Flexible dashboard (1/3) • http://epp.eurostat.ec.europa.eu/statistics_explained/index.php/Labour_market_and_Labour_force_survey_%28LFS%29_statistics
What's next? • New Eurostat website • Statistics Explained main page • Articles written by EU NSIs staff