The Lake Pontchartrain Forecast System
320 likes | 461 Vues
Rick Luettich Jason G. Fleming Institute of Marine Sciences University of North Carolina. The Lake Pontchartrain Forecast System. The Team. University of North Carolina: Rick Luettich, Jason Fleming, Crystal Fulcher

The Lake Pontchartrain Forecast System
E N D
Presentation Transcript
Rick Luettich Jason G. Fleming Institute of Marine Sciences University of North Carolina The Lake Pontchartrain Forecast System
The Team University of North Carolina: Rick Luettich, Jason Fleming, Crystal Fulcher Louisiana State University: Robert Twilley, Gabrielle Allen, Ed Seidel, Brett Estrade University of Notre Dame: Joannes Westerink US Army Corps of Engineers: Harley Winer
Mission Statement Provide real-time support for closure decisions for Orleans Parish outfall canals Predict stages in Lake Pontchartrain at the mouths of the outfall canals Predict wind speeds near the mouths of the canals USACE and LSU provide computing resources
The Scope of Work Calculate storm surge and wind speed using ADCIRC 4 Day forecast completed in within 2 hours Accurate wind conditions and storm surge from a tropical cyclone Ensemble of alternate cyclones that reflect a reasonable range of possible conditions
LPFS in a Nutshell Rely on text advisories from NOAA NHC Automated software system to Download advisories Configure ADCIRC runs Compute wind fields on the fly Assemble output from ADCIRC and plot results at locations of interest Email graphs to decision makers and copy to redundant external websites
Phase I Create mesh with 100k nodes Implement dynamic Holland wind model Verify that we get within 10% of IPET for Katrina Define ensemble of 5 members Plot wind speed and water level at station locations
Holland Wind Model Analytical Description Input data: Central pressure deficit Maximum wind speed Radius to maximum winds
Ensemble Members 1. NHC Consensus storm, 5 day forecast 2. Storm with 20% higher wind speed 3. Storm with 20% slower forward speed 4. Storm that veers along right of cone of uncertainty 5. Storm that veers along left of cone of uncertainty
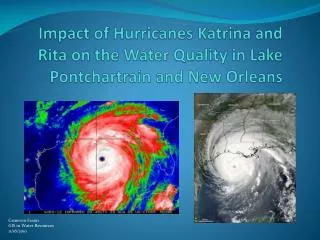
Examples of Early Warning Katrina: veer left storm Rita: veer right storm Ernesto: threat yet or not?
Phase II Modify Phase I to use hotstarting Completed during hurricane season 2006 Initiate daily runs forced by tides Tides are relatively small Strategy change to increase speed Add any other meteorological products Timeliness is main issue Ongoing search for speed and accuracy
Lessons Learned Performance Multi-machine development at LSU Added hotstart capability Generalized system for portability Turnaround times LSU: 1—7 hours initially USACE: 25-30 minutes with real time queue
Lessons Learned Resources Priority access not guaranteed except at USACE Optimization needed for LSU hardware LSU and USACE machines operate redundantly Communications Mirrored results at several redundant websites, including LSU and UNC Enhanced notification emails to include attachments containing graphs of results
Hurricane Season 2007 System oversight Systematically assess wave setup Compute proportionate effect in historical storms Use synthetic pack of storms to calculate a multiplier or; Integrate STWAVE into LPFS Modify storm ensemble
Hurricane Season 2007 Hotstart with tides Hotstart with background meteorology Inclusion of land use characteristics Enhanced user interface Enhanced output Maximum Envelope Of Water (MEOW) Maximum of Maximums (MOM) across ensemble Maximum Envelope of Wind