Exponential distribution Not all things are Normal!
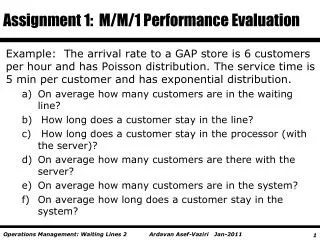
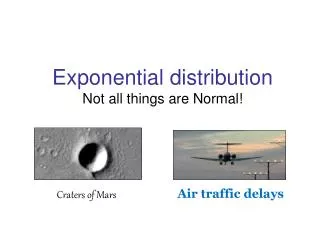
Exponential distribution Not all things are Normal!. Craters of Mars. Air traffic delays. Craters of Mars: An exponential distribution special. The Red Planet.

Exponential distribution Not all things are Normal!
E N D
Presentation Transcript
Exponential distributionNot all things are Normal! Craters of Mars Air traffic delays
The Red Planet …has captured our imagination from early on. Ancient Greeks and Romans related it to Mars, the belligerent God so anxious to go to war, he was… Red In The Face!
Little Green Martians In the 19th and 20th Centuries, many people believed Mars was inhabited by little green creatures who were ready to invade Earth without notice!
NASA’s Mars Missions In 2001, Odyssey orbiter arrived to Mars on a mapping mission. In 2003, NASA sent two Rovers to investigate whether Mars has any life-supporting elements such as water, and explore its natural resources.
Mars 2001 Odyssey The Mars 2001 Odyssey orbiter launched from Kennedy Space Center on 7 April 2001. The orbiter arrived at Mars on 24 October 2001. Upon arrival, the orbiter went into an ~18-hour capture orbit. The orbiter spent the next several months achieving a circular mapping orbit by aerobraking (using the atmosphere to slow and shrink the orbit). Mapping photos of the Central Gusev crater were released on January 14, 2004, by NASA, JLP, and ASU.
Sampling craters Using Gusev’s mapping photo, the diameter of Martian craters could be established visually.
Data collection 111 crater diameters were measured and recorded
Distribution fitting Using the statistical package MINITAB, an estimate of the exponential parameter λ was obtained.
ON THE NEWS: Air traffic delays Airlines love to blame it on the weather, but a new USA TODAY analysis shows the airlines’ own processes may be responsible Pilot shortages, taking too long to refuel, and mechanical breakdowns, are now cited as main reasons. But bad weather can still cause a lot of trouble!
A case study: Atlanta airport delays, Dec 28, 2007 • On Friday, December 28, 2007, a snow storm was developing in the Chicago area
A case study: Atlanta airport delays, Dec 28, 2007 • Meanwhile, weather condition in the Atlanta area were deteriorating • Flight delays at Atlanta’s Hartsfield-Jackson airport can impact air traffic all along the East Coast
A case study: Data collection • As news stories started reporting flight delays, data on Delta flights departing from Hartsfield-Jackson airport (Atlanta) on Friday, December 28, 2007, were collected from the airport’s Web site (www.atlanta-airport.com) • Atlanta-based Delta is responsible for about 70-80 % of the Atlanta airport’s flights
A case study: Data collection • Airport data were cross-checked with airline data obtained from Delta’s Web site (www.delta.com), to establish the actual departure times
A case study: Data collection • Between 8:10 AM and 3:10PM on 12/28/2007, 397 Delta flights were scheduled to depart from Atlanta, but only 286 actually departed • 30 flights were canceled and most others were delayed, typically by 2-3 hours • Actual departure times were ordered and first differences were calculated to obtain 285 inter-departure times
Data collection: Scheduled departures • This time series plot shows the 396 inter-departure times for the 397 Delta flights that were scheduled to fly out of Atlanta on 12/28/2007, in the 8:10 AM – 3:10 PM period
Scheduled departures : Distribution analysis • The inter-departure data might follow an exponential distribution
Data collection: Actual departures • A time series plot of the 285 actual inter-departure times reveals a possible change-point around 12 noon
Actual departures : Distribution analysis • The inter-departure data did not fit an exponential distribution very well • However, a poor fit might be due to the presence of change-points
Exponential Distribution afterthoughts Q: So, how is all that related to our Regression Analysis course? A: Regression Analysis assumes a Normal distribution of the data. Knowing that some things naturally follow a distribution which is far from being normal, allows us to anticipate a violation of the normality assumption. The problem can be fixed by applying a transformation of the data (more details later).