Predicting Novel Transcription Factor Binding Sites in Human: A Machine Learning Approach
Learn how we predict TFBS in human using machine learning SVM. Discover our results, classification methods, and feature associations.

Predicting Novel Transcription Factor Binding Sites in Human: A Machine Learning Approach
E N D
Presentation Transcript
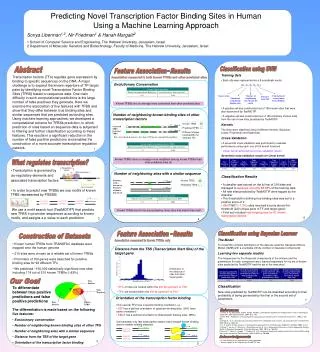
AATGATGC AATGATGC GCATCATT TTACTACG TTACTACG CGTAGTAA Gene 1 Gene 2 GENE X Known TFBS Predicted TFBS Different shapes indicate BSs for different TFs Known TFBS Predicted TFBS Gene 1 Gene 1 AACCCA AACCCA TTGGGT TTGGGT Gene 3 Gene 3 TGGGTT AACCCA ACCCAA TTGGGT Sonya Liberman1,2, Nir Friedman1 & Hanah Margalit2 1 School of Computer Science and Engineering, The Hebrew University, Jerusalem, Israel 2 Department of Molecular Genetics and Biotechnology, Faculty of Medicine, The Hebrew University, Jerusalem, Israel Predicting Novel Transcription Factor Binding Sites in Human Using a Machine Learning Approach Abstract Classification using SVM Feature Association - Results • Training Sets • Each site was represented as a 5-coordinate vector • A positive set was constructed out of 159 known sites that were also discovered by TestMOTIF • A negative set was constructed out of 159 randomly chosen sites from the set of new sites predicted by TestMOTIF • Kernels • The sites were classified using 4 different kernels: Gaussian, Linear, Polynomial and Sigmoidal. • Cross-Validation • A sevenfold cross-validation was performed to evaluate performance using each one of the kernel functions • Linear kernel achieved best cross-validation results • Sevenfold cross-validation results for Linear kernel • Classification Results • A classifier was trained on the full set of 318 sites and managed to separate correctly88.68% of the training data • All new sites predicted by TestMOTIF were tagged by the classifier • The threshold for defining true binding sites was set to a positive score of 2 • 936/73607 (~1.3%) sites received a score above the threshold (222 unique pairs of TF and target gene) • Final set included new target genes for 51 known transcription factors Transcription factors (TFs) regulate gene expression by binding to specific sequences on the DNA. A major challenge is to expand the known repertoire of TF-target pairs by identifying novel Transcription Factor Binding Sites (TFBS) based on sequence data. One main difficulty in such computational predictions is the large number of false positives they generate. Here we examine the association of five features with TFBS and show that they differ between true binding sites and similar sequences that are predicted as binding sites. Using machine learning approaches, we developed a computational scheme for TFBSs prediction, in which prediction of sites based on sequence data is subjected to filtering and further classification according to these features. This results in a significant reduction in the number of false positive predictions and enables the construction of a more accurate transcription regulation network. Association measured in both known TFBSs and other predicted sites Evolutionary Conservation (X1,X2,X3,X4,X5) Conservation Number of neighboring sites that fit the motif Orientation of transcription factor binding Distance from TSS Number of neighboring binding sites Known TFBSs are on average more conserved than other predicted sites Number of neighboring known binding sites of other transcription factors Clustered TFBS Scattered TFBS Sites for which distance is less than 200 bp are considered neighbors 1 Known TFBSs have on average more neighbors among known TFBSs than other predicted sites do What regulates transcription? • Transcription is governed by • cis-regulatory elements and • associated transcription factors • In order to predict new TFBSs we use motifs of known TFBS represented by PSSMS • We use a motif search tool (TestMOTIF6) that predicts new TFBS in promoter sequences according to known motifs, and assigns a p-value to each prediction Number of neighboring sites with a similar sequence Promoter with a knwon site Gene 1 Promoter without a knwon site Gene 2 Known TFBSs tend to be surrounded by other sites that match their motif 6 2 4 Feature Association - Results Classification using Bayesian Learner Construction of Datasets The Model To model the complex distribution of the data we used the Gaussian Mixture Model (GMM) with a countable infinite number of Gaussian components Learning two separate models The frequencies for the Gaussian components of the mixture and the parameters for each component were learned separately for the set of known sites predicted by TestMOTIF and the set of the new sites2 Classification New sites predicted by TestMOTIF can be classified according to their probability of being generated by the first or the second set of parameters Association measured in known TFBSs only • Known human TFBSs from TRANSFAC database were mapped onto the human genome • 210 sites were chosen as a reliable set of known TFBSs • Promoters of 150 genes were searched for putative binding sites for 98 different TFs • We predicted ~150,000 statistically significant new sites including 174 out of 210 known TFBSs (~83%) Distance from the TSS (Transcription Start Site) of the target gene Distribution of the distance of sites from their target genes. Number of real sites Our Goal True Positives Position relative to TSS To differentiate between true positive predictions and false positive predictions • 61% of sites are located within the 200 bp upstream to TSS. • 75% are located within the 400 bp upstream to TSS ? 83% False Negatives Orientation of the transcription factor binding 7 False Positives Known TFBSs • Only several TFs have a specific binding orientation, i.e.: • E2F has a defined orientation of upstream binding sites. (90% have same orientation) • EBOX has a defined orientation of downstream binding sites. (86%) • Unfortunately only few transcription factors have enough known binding sites to enable reliable statistics. • The differentiation is made based on the following five features: • Evolutionary conservation • Number of neighboring known binding sites of other TFS • Number of neighboring sites with a similar sequence • Distance from the TSS of the target gene • Orientation of the transcription factor binding References 1. Sinha, S., M. Blanchette, and M. Tompa, PhyME: a probabilistic algorithm for finding motifs in sets of orthologous sequences. BMC Bioinformatics, 2004. 5: p. 170. 2. Neal, R.M., Regression and classification using Gaussian process priors. Oxford University Press, 1998: p. 475-501. 3. Siepel, A., et al., Evolutionarily conserved elements in vertebrate, insect, worm, and yeast genomes. Genome Res, 2005. 15(8): p. 1034-50. 4. Li, N. and M. Tompa, Analysis of computational approaches for motif discovery. Algorithms Mol Biol, 2006. 1: p. 8. 5. Shane T. Jensen, X. Shirley Liu., Qing Zhou and Jun S. Liu, Computational Discovery of Gene Regulatory Binding Motifs: A Bayesian Perspective. Statistical Science, 2004. 19(1): p. 188-204. 6. Barash Y., Elidan G., Kaplan T., Friedman N. CIS: compound importance sampling method for protein-DNA binding site p-value estimation. Bioinformatics, 2005. 1;21(5): p. 596-600. Acknowledgements 3 • Dr. Yael Altuvia for her help with the feature definition • Tommy Kaplan for his help with the TestMOTIF tool 5