Download
1 / 1
10 likes | 127 Vues
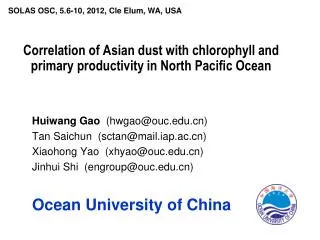
Dust transport from non-East Asian sources to the North Pacific. Shih-Chieh Hsu 1 , Chih-An Huh 2* , Chuan-Yao Lin 1 , Wei-Nai Chen 1 , Natalie M.Mahowald 3 , Shaw-Chen Liu 1,4 , C.C.K. Chou 1 , Mao-Chang Liang 1 , Chuen-Jinn Tsai 5 , Fei-Jan Lin 6 , Jen-Ping Chen 4 , Yi-Tang Huang 1.

E N D
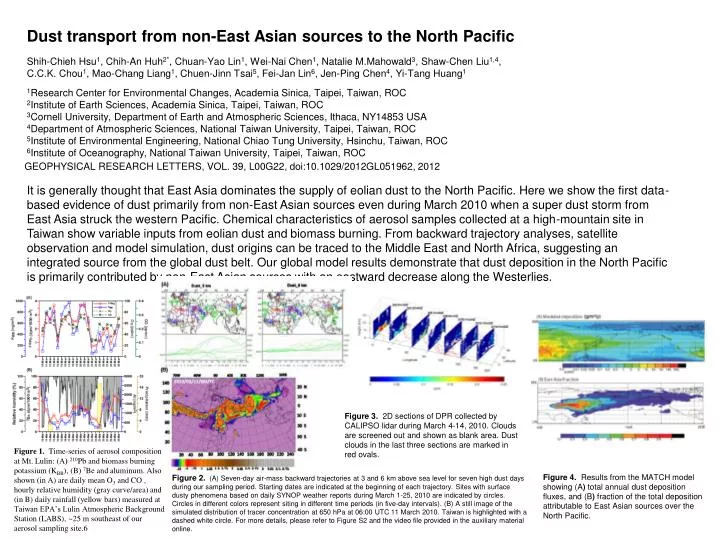
Dust transport from non-East Asian sources to the North Pacific Shih-Chieh Hsu1, Chih-An Huh2*, Chuan-Yao Lin1, Wei-Nai Chen1, Natalie M.Mahowald3, Shaw-Chen Liu1,4, C.C.K. Chou1, Mao-Chang Liang1, Chuen-Jinn Tsai5, Fei-Jan Lin6, Jen-Ping Chen4, Yi-Tang Huang1 1Research Center for Environmental Changes, Academia Sinica, Taipei, Taiwan, ROC 2Institute of Earth Sciences, Academia Sinica, Taipei, Taiwan, ROC 3Cornell University, Department of Earth and Atmospheric Sciences, Ithaca, NY14853 USA 4Department of Atmospheric Sciences, National Taiwan University, Taipei, Taiwan, ROC 5Institute of Environmental Engineering, National Chiao Tung University, Hsinchu, Taiwan, ROC 6Institute of Oceanography, National Taiwan University, Taipei, Taiwan, ROC GEOPHYSICAL RESEARCH LETTERS, VOL. 39, L00G22, doi:10.1029/2012GL051962, 2012 It is generally thought that East Asia dominates the supply of eolian dust to the North Pacific. Here we show the first data-based evidence of dust primarily from non-East Asian sources even during March 2010 when a super dust storm from East Asia struck the western Pacific. Chemical characteristics of aerosol samples collected at a high-mountain site in Taiwan show variable inputs from eolian dust and biomass burning. From backward trajectory analyses, satellite observation and model simulation, dust origins can be traced to the Middle East and North Africa, suggesting an integrated source from the global dust belt. Our global model results demonstrate that dust deposition in the North Pacific is primarily contributed by non-East Asian sources with an eastward decrease along the Westerlies. Figure 3. 2D sections of DPR collected by CALIPSO lidar during March 4-14, 2010. Clouds are screened out and shown as blank area. Dust clouds in the last three sections are marked in red ovals. Figure 1. Time-series of aerosol composition at Mt. Lulin: (A)210Pb and biomass burning potassium (KBB), (B) 7Be and aluminum. Also shown (in A) are daily mean O3 and CO , hourly relative humidity (gray curve/area) and (in B) daily rainfall (yellow bars) measured at Taiwan EPA’s Lulin Atmospheric Background Station (LABS), ~25 m southeast of our aerosol sampling site.6 Figure4. Results from the MATCH model showing (A) total annual dust deposition fluxes, and (B) fraction of the total deposition attributable to East Asian sources over the North Pacific. Figure 2. (A) Seven-day air-mass backward trajectories at 3 and 6 km above sea levelfor seven high dust days during our sampling period. Starting dates are indicated at the beginning of each trajectory. Sites with surface dusty phenomena based on daily SYNOP weather reports during March 1-25, 2010 are indicated by circles. Circles in different colors represent siting in different time periods (in five-day intervals). (B) A still image of the simulated distribution of tracer concentration at 650 hPa at 06:00 UTC 11 March 2010. Taiwan is highlighted with a dashed white circle. For more details, please refer to Figure S2 and the video file provided in the auxiliary material online.