Understanding Measures of Dispersion: Standard Deviation and Variance Explained
This lesson introduces the concept of measures of dispersion, emphasizing their significance in understanding data variability beyond just the mean. We analyze three classes with identical mean scores, yet differing levels of spread among student grades. The implications of standard deviation and variance are explored, illustrating how these metrics help assess the distribution of data points. Calculating range, standard deviation, and variance will be undertaken, with a clear explanation of their relevance in both population and sample data analysis.

Understanding Measures of Dispersion: Standard Deviation and Variance Explained
E N D
Presentation Transcript
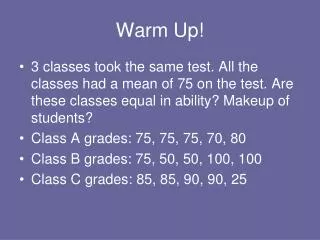
Warm Up! • 3 classes took the same test. All the classes had a mean of 75 on the test. Are these classes equal in ability? Makeup of students? • Class A grades: 75, 75, 75, 70, 80 • Class B grades: 75, 50, 50, 100, 100 • Class C grades: 85, 85, 90, 90, 25
Measures of Dispersion (Spread) for Ungrouped Data Section 3.2
Measures of Dispersion • Spread or Variation of data give a better picture of the overall data than just Mean, Median or mode alone. • Range = Largest value – Smallest value.
Standard Deviation(S or σ) • Most used measure of spread. • Tells how close the data values are clustered around the mean. • Small Standard Deviation means values are close to mean. • Large Standard Deviation mean values are spread out from mean.
Variance (S2 or σ2) • Obtain the Standard deviation by taking the square root of the variance. Population: σ2 = ∑(x - µ)2 N Sample: S2 = ∑(x - x)2 n-1 • The sum of the deviations from the mean, ∑(x – x), is always 0, so we square them.
Standard Deviation and Variance • Are always positive. • Only = 0 if all values in data set are the same. • The unit of measure of Standard Deviation is the same as the data set. • Population Parameters – Numerical measures of the population. • Sample Statistics – Numerical measures of a sample.