Download
1 / 38
380 likes | 398 Vues
Learn about the role of public health system in surveillance, data collection, analysis, and decision-making. Understand different types of data and measures of central tendency. Explore the information flow in the weekly surveillance system.

E N D
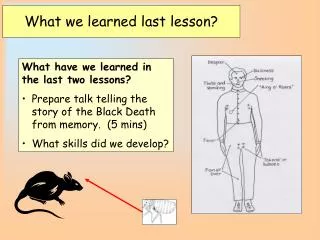
What have we learned in the last two weeks Key take home messages from the Integrated Disease Surveillance Programme (IDSP) district surveillance officers (DSO) course
Action Data Information Interpretation Analysis Surveillance: A role of the public health system The systematic process of collection, transmission, analysis and feedback of public health data for decision making Surveillance
Collect and transmit data Make decisions Analyzedata Feedbackinformation A dynamic vision of surveillance All levels use information to make decisions The private sector can treat patients butonly the public sector can coordinate surveillance Surveillance
Type of data: Summary Qualitative Binary Nominal Ordinal Sex Nationality Status M Yemen Mild M Jordan Moderate F Yemen Severe M Jordan Mild F Sudan Moderate F Yemen Mild M Sudan Moderate M Iran Severe F Jordan Severe M Iran Mild F Yemen Moderate F Sudan Moderate M Iran Mild M Yemen Severe M Jordan Severe F Jordan Moderate M Iran Mild F Sudan Mild M Yemen Mild Quantitative Discrete Continuous Children Weight 1 56.4 1 47.8 2 59.9 3 13.1 1 25.7 1 23.0 2 30.0 3 13.7 2 15.4 2 52.5 1 26.6 1 38.2 1 59.0 2 57.9 2 19.6 3 31.7 2 15.1 3 33.9 1 45.6
Quick definitions of measures of central tendency • Mode • The most frequently occuring observation • Median • The mid-point of a set of orderedobservations • Arithmetic mean • Aggregate / sum of the given observations divided by the number of observation
Prevalence – (P) • Number of existing cases (old and new) in a defined population at a specified point of time Number pf people with disease at a specified time P = ---------------------------------------------------- x 10n Population at risk at the specified time • In some studies the total population is used as an approximation if data on population at risk is not available Prevalence
Incidence – (I) • Number of new cases in a given period in a specified population • Time, (i.e., day, month, year) must be specified • Measures the rapidity with which new cases are occurring in a population • Not influenced by the duration of the disease Incidence
Reporting units for disease surveillance Reporting units
Types of case definitions in use More specificity Case definitions
Information flow of the weekly surveillance system Sub-centres Programme officers C.S.U. S.S.U. P.H.C.s C.H.C.s D.S.U. Pvt. practitioners Dist. hosp. Nursing homes Private hospitals Med. col. Private labs. P.H. lab. Other Hospitals: ESI, Municipal Rly., Army etc. Corporate hospitals
District surveillance committee Representative Water Board CMO (Co. Chair) District Program Manager Polio, Malaria, TB, HIV - AIDS Superintendent Of Police Chief District PH Laboratory IMA Representative District Data Manager (IDSP) Chairperson* District surveillance committee NGO Representative Representative Pollution Board Superintendent of hospitals District Training Officer (IDSP) District Panchayat Chairperson Medical College Representative if any * District collector or district magistrate District Surveillance Officer (Member Secretary)
Case Feedback Reporting unit Immediately Lab slip Outpatient register Inpatient slip Weekly Lab register Weekly Inpatient register Common reporting form P +ve slides + sample -ves Form L Weekly District public health laboratory District surveillance officer Computer(District)
Functions of the district surveillance unit • Managerial • Implement and monitor all project activities • Coordinate with laboratories, medical colleges, non governmental organizations and private sector • Organize training and communication activities • Organize district surveillance committee meetings • Data handling • Centralize data • Analyze data • Send regular feedback • Outbreak response • Constitute rapid response teams • Investigate
REC SEX --- ---- 1 M 2 M 3 M 4 F 5 M 6 F 7 F 8 M 9 M 10 M 11 F 12 M 13 M 14 M 15 F 16 F 17 F 18 M 19 M 20 M 21 F 22 M 23 M 24 F 25 M 26 M 27 M 28 F 29 M 30 M Distribution of cases by sex Table Data Information Graph Data analysis is about data reduction Why analyze?
1. Count, Divide and Compare (CDC): An epidemiologist calculates rates and compare them • Direct comparisons of absolute numbers of cases are not possible in the absence of rates • CDC • Count • Count (compile) cases that meet the case definition • Divide • Divide cases by the corresponding population denominator • Compare • Compare rates across age groups, districts etc. CDC for TPP
2. Time, place and person descriptive analysis • Time • Incidence over time • Place • Map • Person • Breakdown by age, sex or personal characteristics CDC for TPP
TIME: Incidence graph Malaria in Kurseong block, Darjeeling District, West Bengal, India, 2000-2004 45 40 Incidence of malaria 35 Incidence of Pf malaria 30 25 Incidence of malaria per 10,000 20 15 10 5 0 May July July July July July May May May May April April April April April June June June June June February March March March March March August August August August August January October January October January October January October January October February February February February November December November December November December November December November December September September September September September 2000 2001 2002 2003 2004 Months Interpretation: There is a seasonality in the end of the year and a trend towards increasing incidence year after year Reports
PLACE: Map Incidence of acute hepatitis (E) by block, Hyderabad, AP, India, March-June 2005 Attack rate per100,000 population 0 1-19 20-49 50-99 100+ Open drain Interpretation: Blocks with hepatitis are those supplied by pipelines crossing open sewage drains Pipeline crossing open sewage drain
PERSON: Incidence by age and sex Probable cases of cholera by age and sex, Parbatia, Orissa, India, 2003 Nu m b e r of c a s es Po pu l a t i on I nc i d e nc e A g e g r o up 0 t o4 6 1 1 3 5 . 3 % ( In y e ar s ) 5 t o1 4 4 1 9 0 2 . 1 % 1 5 to 2 4 5 1 2 8 3 . 9 % 2 5 to 3 4 5 1 4 4 3 . 5 % 3 5 to 4 4 6 1 2 9 4 . 7 % 4 5 to 5 4 4 8 8 4 . 5 % 5 5 to 6 4 8 6 7 1 1 . 9 % > 6 5 3 8 7 3 . 4 % S ex M a l e 1 7 4 8 1 3 . 5 % F e m a l e 2 4 4 6 5 5 . 2 % Tot al T ot a l 4 1 9 4 6 4 . 3 % Interpretation: Older adults and women are at increased risk of cholera CDC for TPP
Components of early warning surveillance Analyze Filter Signal Signal Validate Verify Surveillance: Case-based surveillance Event-based surveillance Data Reports Alert Response Assess Public health alert InvestigateControl measures Post-outbreak strengthening Evaluate Early warning
Progressive response • Levels of alert are progressively increasing • Unusual signals require filtering / validation • The best chance of detection is to: • Analyze regularly • Be familiar with the time, place and person characteristics of the diseases in your area Triggers
Verify Recognize the magnitude Diagnose the agent Identify the source and mode of transmission Formulate prevention and control measures Host Environment Agent An outbreak comes from a change in the way the host, the environment and the agent interact: This interaction needs to be understood to propose recommendations Objectives of an outbreak investigation Investigations
Working well with the laboratory • Develop rapport with the laboratory • Collect specimen according to the guidelines and access on-line resources if needed • Protect the patient, yourself and others with biosafety • You can contribute to quality assurance!
Steps of a full outbreak investigation using analytical epidemiology to identify the source of infection • Determine the existence of an outbreak • Confirm the diagnosis • Define a case • Search for cases • Generate hypotheses using descriptive findings • Time, place and person information • Test hypotheses based upon an analytical study • Compare cases with non cases • Draw conclusions • Compare the hypothesis with established facts • Communicate findings • Execute prevention measures
Maximizing the chances that results of an investigation is used for action • Appreciate the point of view of the manager • Don’t flag problems • Provide solutions • Understand that your recommendations have implications for resources allocation • Deliver useful recommendations • Evidence based • Specific • Feasible • Cost effective • Acceptable • Ethical Decision makers
Communicating results effectively • Communicate WITH and not TO the audience • Keep in mind what is needed out of people • Pilot test communication material • Have your oral presentations guided by a clear SOCO
The six “S” of technical writing • Simple • Short • Structured • Sequential • Strong • Specific The six “S”
Using high-level outlines to prepare a report • Skeleton of the report in bullet points • Outline of various sections • Spell out all titles • Use outline format of word processors • Summarize each paragraph with a bullet point • List of tables and figures • Spell out titles • Reach consensus on the outline • Expand The six “S”
Always add summary to your reports • The audience of your report may be too busy to read it completely • Summary: • < one page • < 300 words • Structure your summary with subheadings "I'm sorry to write you a long letter. I had no time to write a shorter one” Mark Twain The six “S”
Rationale for feedback of surveillance data • Motivation • Those who collected data see how they fit in the bigger picture • Reliability • Identifies errors • Reactivity • Places everyone on the same page • Quality • Increases transparency • Education • Demonstrates how the system works
Data flow and feedback: Level by level Centre State Feedback Data District Primary / Community health centre Community
Content of feedback • Information on diseases under surveillance • Summary data tables • Analyzed epidemiological information • Time (Graphs with trends) • Place (Maps) • Persons (Tables) • Information on quality of data collected
Content of feedback • Information on diseases under surveillance • Information on quality of data collected • Regularity of reporting • Timeliness of reporting • Completeness of reporting • Responses initiated by the unit • Validity of data
Integrated disease surveillance programme activities to be monitored • Collection and compilation of data • Laboratory • Analysis and interpretation • Follow-up action • Feedback Monitoring
The supervision visit • Activities during the visit • Use checklist • Observe • Review records • Conduct focus group discussions with staff • Provide feedback • Underline achievements • Mention opportunities for improvement • Recommend actions with a time frame Supervision
Action Data Information Interpretation Analysis Go back to your district and be an active District Surveillance officer Systematically, collect, transmit, analyze and feedback public health data for decision making Surveillance
Your assignment for the next two weeks • Go back to your district • Pick up one disease of public health interest • Analyze the data by time, place and person • Produce a report with: • 1 page of text, with conclusions and recommendations • 1 graph of incidence over time • 1 map • 1 table of incidence by age and sex • Share locally and send us a copy within 2 weeks! • We will give you feedback! • Use the data for action and make it a habit! Supervision