Download

1 / 14
140 likes | 160 Vues
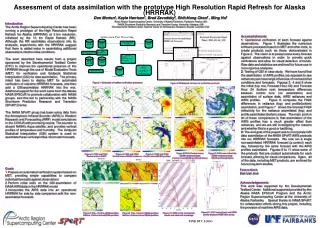
This case study explores the impact of assimilating AIRS profile data into the forecasting model to improve weather forecasts. Results show accurate temperature and moisture predictions along with enhanced precipitation forecasts in specific regions. The study demonstrates the valuable contribution of AIRS profiles in filling observational gaps and enhancing forecast accuracy.

E N D
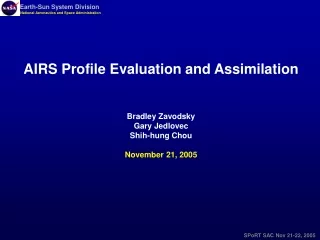
AIRS Profile Assimilation - Case Study results Shih-Hung Chou, Brad Zavodsky Gary Jedlovec, and Bill Lapenta
Motivation for Profile Assimilation at SPoRT • The SPoRT Center seeks to improve short-term weather forecasts by the use of satellite-based observation. • AIRS data complement traditional upper-air observations in data-sparse regions (both ocean and land) • In contrast to AIRS radiances, profiles provide an easier assimilation method allowing regional and local end users (e.g. HUN WFO) to run NWP systems • Hyperspectral nature of AIRS sounder allows for high-resolution data
AIRS Specifications • Aboard Aqua polar orbiter • Early afternoon equator crossing • 2378 spectral channels • 3.7 – 15.4 μm (650 – 2675 cm-1) • 3 x 3 footprints (50 km spatial resolution) • AMSU allows for retrievals in both clear and cloudy scenes • Version 4.0 Error Estimates (Tobin et al. 2006) • 0.6-1.0K over ocean (± 50o latitude) • 0.9-1.3K global ocean and land (in 1 km layers) • < 15% RH (in 2 km layers)
AIRS Data Quality Indicators 0700 UTC 20 November 2005 AIRS swath • Quality indicators (QIs) in prototype v5: • each profile contains level-specific QI • level-by-level error estimates for each T and q profile • QIs allow for the maximum amount of quality data to be assimilated • optimal use of QIs should produce an analysis that provides better initial conditions for the WRF
Lessons Learned from Previous SAC • 4 January, 2004 • Pacific storm stalled off shore; limited its impact on land • Difficult to evaluate AIRS impact due to insufficient RAOB stations and stage IV precip datafor verification • Mixed results for AIRS impact on forecast
L L L Surface analysis 11/20/05 12 UTC Surface analysis 11/22/05 12 UTC Surface analysis 11/22/05 12 UTC Case Study: November 20-22, 2005 Rapidly intensifying storm off the eastern seaboard under forecasted by GFS, NAM, and SPoRT operational WRF Case Selection • relevant to SPoRT interests in SEUS region • ample verification data available over the Eastern US synoptic setting • opportunity to eventually test both over-ocean and over-land AIRS profiles • comparable CONUS domain to other SPoRT WRF for easy transfer to operational applications
WRF Domain for November 2005 Case Study L L L Analysis and Forecast Model Configuration WRF Model Configuration • 36km domain with 150x360 grid • 37 vertical levels • Initialized with NAM analysis, LBC updated every 3 h • ADAS Analysis Configuration • Same horizontal domain as WRF • 43 vertical levels separated by 500 m • AIRS profiles are assimilated as RAOBs using QIs to determine highest quality data • use Tobin et al. (2006) for observation error and standard model errors for background Assimilation / Forecast • 7h forecast used as background for ADAS AIRS valid at 0700 UTC 00 UTC ADAS 7h FCST 11/21/05 00 UTC 00 UTC Validation at 00 UTC and 12 UTC 11/20/05 11/22/05
700 hPa Dew Point Difference AIRS data have a major drying off east seaboard Impact of AIRS Profiles on ADAS Analysis 700 hPa Temp Difference AIRS data have an cooling impact over Atlantic, but a warming impact on land
AIRS shows cooling in the lower and upper troposphere • AIRS shows drying above 900 hPa Impact of AIRS Profiles on ADAS Analysis 20 November 2005 Wallops Island, VA 07Z BKGD 07Z AIRS 07Z ADAS
AIRS shows mid-troposphere cooling • AIRS correctly detects the moistening of 700-500 hPa layer • AIRS shows drying above 500 hPa Impact of AIRS Profiles on Initial Conditions 20 November 2005 Wallops Island, VA 07Z BKGD 07Z AIRS 07Z ADAS 00Z RAOB 12Z RAOB • AIRS shows cooling in the lower and upper troposphere • AIRS shows drying above 900 hPa AIRS can spatially and temporally fill the gap between conventional observations
AIRS cools T by as much as 0.5oC (improvement) in much of troposphere; increases q bias at mid-levels • AIRS reduces RMS error in T and q at most levels Temperature and Moisture Impact • Control is too warm and moist at all tropospheric levels
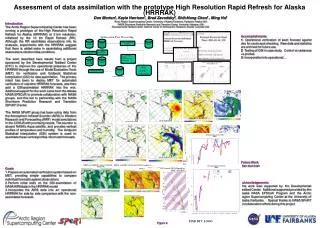
6-h Cumulative Precipitation Impact • CNTL over-forecast over the low center and under forecast over TN/AL • AIRS improves forecast compared to NCEP Stage IV data in region of heaviest precipitation
CNTL AIRS 6-h Cumulative Precipitation Impact Qualitative Precipitation Forecast Bias Score • a measure of precip coverage • Precipitation under-forecasted • CNTL better at middle threshold; AIRS better at high Equital Threat Score • a measure of precip loaction • AIRS outperforms CNTL at most threshold; similar at smallest threshold
Summary • AIRS Level-2 profiles provide valuable data over regions otherwise devoid of upper-air observations; they also fill the gap in time between the conventional observations • Level-specific QIs for AIRS profiles allow for the assimilation of the largest volume of highest quality data • AIRS data improves forecasts of T, q, and 6 h precip Future plans involving AIRS • Real-time forecasts to evaluate long-term impact • Select new case studies for in-depth analysis