Measures of Central Tendency
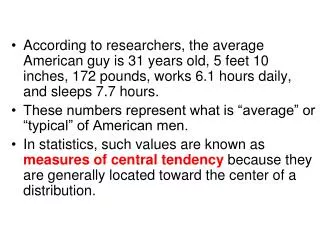
100 likes | 405 Vues
Measures of Central Tendency. Consider the Measurements and Frequency Table Generated in the previous lecture. 87, 85, 79, 75, 81, 88, 92, 86, 77, 72, 75, 77, 81, 80, 77, 73, 69, 71, 76, 79, 83, 81, 78, 75, 68, 67, 71, 73, 78, 75, 84, 81, 79, 82, 87, 89, 85, 81, 79, 77, 81, 78, 74, 76, 82,

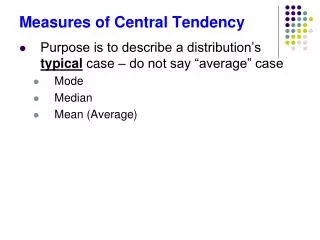
Measures of Central Tendency
E N D
Presentation Transcript
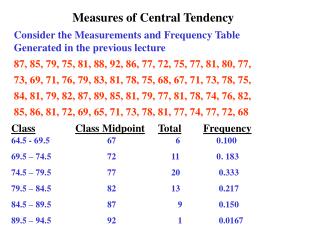
Measures of Central Tendency Consider the Measurements and Frequency Table Generated in the previous lecture 87, 85, 79, 75, 81, 88, 92, 86, 77, 72, 75, 77, 81, 80, 77, 73, 69, 71, 76, 79, 83, 81, 78, 75, 68, 67, 71, 73, 78, 75, 84, 81, 79, 82, 87, 89, 85, 81, 79, 77, 81, 78, 74, 76, 82, 85, 86, 81, 72, 69, 65, 71, 73, 78, 81, 77, 74, 77, 72, 68 ClassClass MidpointTotalFrequency 64.5 - 69 .5 67 6 0.100 69.5 – 74.5 72 11 0. 183 74.5 – 79.5 77 20 0.333 79.5 – 84.5 82 13 0.217 84.5 – 89.5 87 9 0.150 89.5 – 94.5 92 1 0.0167
Measures of Central Tendency • We have determined that the lowest and highest readings in this set of measurements are: • Low = 65 • High = 92 This gives a range = 92 – 25 = 27 The simplest measurement of central tendency in this population is the midrange. Define: midrange = (low value + high value)/2 Midrange = (65 + 92)/2 = 157/2 = 78.5
Measures of Central Tendency The most descriptive measure of central tendency in a population is its mean, because the mean of a sample taken from the population can be shown to be predictive of the population mean within some range determined by the sampling error. Define the population mean by the formula μ = Σi xi/N where μ = the population mean Σi xi = the sum over each member of the population xi N = the number of items in the population
Measures of Central Tendency For the 60 temperature readings in this population we obtain: 87, 85, 79, 75, 81, 88, 92, 86, 77, 72, 75, 77, 81, 80, 77, 73, 69, 71, 76, 79, 83, 81, 78, 75, 68, 67, 71, 73, 78, 75, 84, 81, 79, 82, 87, 89, 85, 81, 79, 77, 81, 78, 74, 76, 82, 85, 86, 81, 72, 69, 65, 71, 73, 78, 81, 77, 74, 77, 72, 68 μ = (87+85+ 79 +….+72+68)/60 = 4751/60 = 79.183
Measures of Central Tendency A third measure of central tendency is the median • The median of a population of size N is found by • Arranging the individual measurements in ascending order, and • If N is odd, selecting the value in the middle of this list as the median (there will be the same number of values above and below the median) • If N is even find the values at position N/2 and N/2 + 1 in this list (call them xN/2 and xN/2+1) and let median be given by the formula median = (xN/2 + xN/2+1)/2 or be the value halfway between these two measurements. Note! When N is even the median will usually not be an actual value in the population
Measures of Central Tendency We now find the median of the population of temperature readings 87, 85, 79, 75, 81, 88, 92, 86, 77, 72, 75, 77, 81, 80, 77, 73, 69, 71, 76, 79, 83, 81, 78, 75, 68, 67, 71, 73, 78, 75, 84, 81, 79, 82, 87, 89, 85, 81, 79, 77, 81, 78, 74, 76, 82, 85, 86, 81, 72, 69, 65, 71, 73, 78, 81, 77, 74, 77, 72, 68 Arrange these 60 measurements in ascending order 65, 67, 68, 68, 69, 69, 71, 71, 71, 72, 72, 72, 73, 73, 73, 74, 74, 75, 75, 75, 75, 76, 76, 77, 77, 77, 77, 77, 77, 78, 78, 78, 78, 79, 79, 79, 79, 80, 81, 81, 81, 81, 81, 81, 81, 81, 82, 82, 83, 84, 85, 85, 85, 86, 86, 87, 87, 88, 89, 92 Since N/2 = 30 and both the 30th and 31st values in the list are the same, we obtain median = 78
Measures of Central Tendency One further parameter of a population that may give some indication of central tendency of the data is the mode Define: mode = most frequently occurring value in the population From the previous data we see: 65, 67, 68, 68, 69, 69, 71, 71, 71, 72, 72, 72, 73, 73, 73, 74, 74, 75, 75, 75, 75, 76, 76, 77, 77, 77, 77, 77, 77, 78, 78, 78, 78, 79, 79, 79, 79, 80, 81, 81, 81, 81, 81, 81, 81, 81, 82, 82, 83, 84, 85, 85, 85, 86, 86, 87, 87, 88, 89, 92 That the value 81 occurs 8 times mode = 81 Note! If two different values were to occur most frequently, the distribution would be bimodal. A distribution may be multi-modal.
median mean Measures of Central Tendency Next we show where each of these parameters occur in the frequency distribution graph for this tabulated data. Frequency % 42 39 36 33 30 27 24 21 18 15 12 9 6 3 0 Mean = 79.183 Median = 78 x Midrange = 78.5 Mode = 81 x x x x x 67 72 77 82 87 92 Temperature
Measures of Central Tendency In the previous pages we have calculated the mean from the raw data. We can also use the tabulated data to calculate the mean of the population Use the formula μ = Σi(fi * xi) / Σi fi Where xi = the midpoint of the ith class and fi = the number of items in the ith class
Measures of Central Tendency From the table we obtain ClassClass Midpoint (x)Total (f)Frequencyf*x 64.5 - 69 .5 67 6 0.100 402 69.5 – 74.5 72 11 0. 183 792 74.5 – 79.5 77 20 0.333 1540 79.5 – 84.5 82 13 0.217 1066 84.5 – 89.5 87 9 0.150 783 89.5 – 94.5 92 1 0.0167 9260 4675 μ = Σi(fi * xi) / Σi fi = 4675/60 = 77.917 The small discrepancy between these two values for the mean is due to the way the data is accumulated into classes. The mean of the raw data is more accurate, the mean of the tabulated data is often more convenient to obtain.