Download
1 / 19
190 likes | 295 Vues
This research paper explores core inflation estimators and their significance for the Central Bank of Brazil. It discusses the motivation for core inflation as a vital measure in monetary policy, particularly within Mercosur countries. The paper examines various core inflation methods used, including the trimmed mean and asymmetric trimmed mean, and evaluates their statistical features and effectiveness in describing inflation trends. Additionally, it emphasizes the importance of timely and reliable core measures for economic analysis, concluding with suggestions for further research and methodological improvements.

E N D
Estimators for IPCA core inflation Francisco Marcos R. Figueiredo Roberta Blass Staub June 7th, 2001 Research Department Central Bank of Brazil
1 - Motivation • Relevant inflation for Central Bank • Core inflation as a common indicator within Mercosur
3 – Core inflation in Brazil • FGV - trimmed mean with smoothed components (IPC-BR) • IPEA - common trend of prices and smoothed trimmed mean • Pichetti & Toledo - dynamic factor index and asymmetric trimmed mean • Central Bank - trimmed mean with smoothed components
4 – Desired characteristics of a core measure • Timely computable • Forward looking nature • Good performance in description of the evolution of the inflation in the past • Easy understanding • Definitive • Theoretical base
5 – Statistical features of core inflation • Less volatile than the headline inflation • Long run stable relation with inflation • Inflation attractor (time precedence)
6 - Core inflation estimates • Exclusion method • Symmetric trimmed mean with smoothed series • Asymmetric trimmed mean
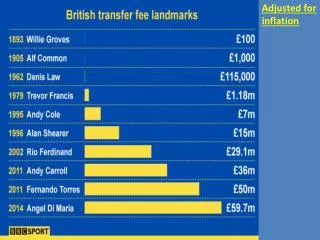
7 - Exclusion method • IPCA less food at home and administered prices • Excluded items amount 46% of IPCA basket
8 – Exclusion method Chart 1 - IPCA and exclusion core, Jan/96 through Apr/2001
9 – Symmetric Trimmed mean % (1-2)% %
11 – 20% Trimmed mean Chart 2 - IPCA and 20% trimmed-mean core, Jan/96 through Apr/2001
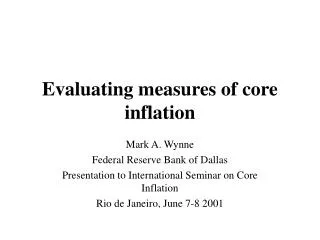
12 - Bryan & Cecchetti core • Bryan and Cecchetti (2001) • Asymmetric trimmed mean centered at 60th percentile • 24-month moving average • Optimal trims • 14.4% - lower tail • 9.6% - upper tail
13- Bryan & Cecchetti core Chart 3 -IPCA e Bryan & Cecchetti core , Jan/96 through Apr/2001
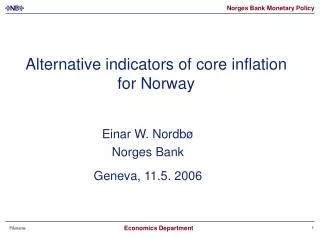
15 - Granger causality tests • Exclusion core • does not cause IPCA • is caused by IPCA • Trimmed 20 core • causes IPCA ( 2 lags) • is not caused by IPCA • Bryan & Cecchetti core • causes IPCA • is not caused by IPCA
Response of TRIM20 to TRIM20 Response of TRIM20 to IPCA 0.0015 0.0015 0.0010 0.0010 0.0005 0.0005 0.0000 0.0000 -0.0005 -0.0005 1 2 3 4 5 6 7 8 9 10 1 2 3 4 5 6 7 8 9 10 Response of IPCA to TRIM20 0.004 0.004 0.003 0.003 0.002 0.002 0.001 0.001 0.000 0.000 -0.001 -0.001 1 2 3 4 5 6 7 8 9 10 1 2 3 4 5 6 7 8 9 10 16 - Impulse response from a bivariate VAR IPCA and Trim 20 - Response to One S.D. Innovations ± 2 S.E. Response of IPCA to IPCA
17 - Concluding remarks • A essential tool to track the inflation trend path • Use a set of core inflation indicators
18 - Further research • Use bootstrapping procedures to check the optimal trims in symmetric and asymmetric trimmed means • Combine different core inflation estimates