Download
1 / 30
360 likes | 700 Vues
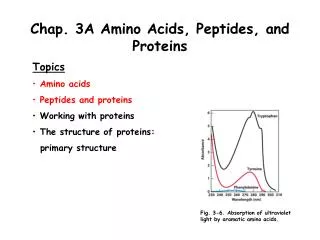
Chap. 3B Amino Acids, Peptides, and Proteins. Topics Amino acids Peptides and proteins Working with proteins The structure of proteins: primary structure. Fig. 3-6. Absorption of ultraviolet light by aromatic amino acids. Overview of Protein Purification.

E N D
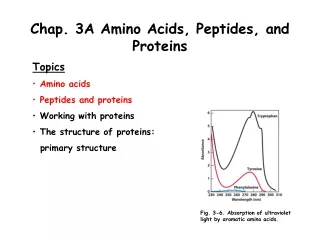
Chap. 3B Amino Acids, Peptides, and Proteins • Topics • Amino acids • Peptides and proteins • Working with proteins • The structure of proteins: • primary structure Fig. 3-6. Absorption of ultraviolet light by aromatic amino acids.
Overview of Protein Purification To study a protein in detail, a researcher must be able to separate it from other proteins in pure form and must have the techniques to determine its properties. To purify a protein, one usually starts with a crude extract of a tissue or cell sample and separates the proteins within it into fractions. Given that the initial volume of the crude extract is relatively large a researcher typically applies a technique like ammonium sulfate precipitation to reduce the size of the sample and the number of proteins within it. With ammonium sulfate precipitation, one exploits differences in the solubility of proteins in salt solution to obtain a fraction that is enriched in the protein of interest. Throughout the multiple steps of protein purification, the researcher must have available some type of assay for monitoring the presence of the protein. Subsequent to ammonium sulfate precipitation, investigators typically apply column chromatography procedures to further purify the protein.
Column Chromatography Column chromatography procedures can separate proteins based on their net charge at a given pH (ion-exchange chromatography), their relative sizes (size-exclusion chromatography), and their ligand binding specificity (affinity chromatography). The general principle behind column chromatography procedures is illustrated in Fig. 3-16. As different proteins percolate through the column they are separated based on their physical properties. The effluent fraction containing the protein of interest can be identified based on an enzymatic or other type of assay.
Ion-exchange Chromatography In ion-exchange chromatography, proteins are separated based on differences in the sign and magnitude of their charges at a given pH (Fig. 3-17a). So-called cation exchange resins are used to fractionate positively charged proteins in a mixture. These resins contain bound negative functional groups (inset). Anion exchange resins are used to fractionate negatively charged proteins in a mixture. Anion exchange resins contain bound positive functional groups. With both techniques proteins having the same net charge as the resin move through the column relatively quickly. Proteins with a net charge that is opposite to that of the resin are retained, and ultimately are released by adjusting the pH or salt concentration of the elution buffer.
Size-exclusion Chromatography In size-exclusion chromatography (gel filtration) proteins are separated based on their size (molecular weight) (Fig. 3-17b). The resin used in size-exclusion chromatography is uncharged, but contains pores into which small solutes/proteins may be able to penetrate. For this reason, the largest proteins move through the column the fastest, whereas small proteins/salts are retained longer. Size exclusion chromatography in the presence of standards of known Mr can be used to determine the approximate molecular weight of an unknown protein.
Affinity Chromatography In affinity chromatography, the resin in the column contains a covalently attached chemical group called a ligand that is bound by the protein of interest (Fig. 3-17c). Thus when a mixture of proteins containing the protein that recognizes the ligand is applied to the column, other proteins pass through in a wash of the column, while the protein of interest is retained. The protein of interest ultimately is eluted from the column by adding a buffer containing the free ligand. The free ligand competes with the bound ligand for binding to the protein of interest, and the protein dissociates from the resin. Very often, affinity chromatography gives the largest fold-purification of any step used in protein purification.
High-performance Liquid Chromatography In high-performance liquid chromatography (HPLC), the elution buffer is pumped over the resin at high pressure and speed. This reduces the transit time of the protein on the column and improves the resolution of separation by reducing diffusional spreading of protein bands during elution.
Purification Tables The progress of purification of a protein of interest is recorded in a purification table (Table 3-5). With each step, the mass of total protein recovered is reduced while the specific activity (units/mg) of the protein fraction becomes greater.
SDS PAGE Sodium dodecyl sulfate polyacrylamide gel electrophoresis (SDS PAGE) is a routinely applied analytical method to estimate the purity and molecular weight of proteins in a sample (Fig. 3-18). Proteins are dissolved in a buffer containing SDS and separated on a polyacrylamide gel matrix by the application of an electrical field (see next slide for mechanism of separation). The locations of proteins on the gel after electrophoretic separation is determined by staining with a protein reactive dye such as Coomassie blue dye. The figure shows an application where SDS PAGE was used to monitor the status of purification of the RecA protein of E. coli.
Mr Estimation by SDS PAGE In SDS PAGE, proteins are uniformly coated by SDS with about one molecule of SDS being bound per amino acid residue. Since SDS is strongly negatively charged under the electrophoresis buffer conditions used, all proteins adopt a roughly equal charge to mass ratio. They further all adopt a rod-shaped structure in solution. Thus separation occurs based solely on Mr, with smaller proteins moving faster than larger proteins through the sieving matrix of the gel. The Mr of an unknown protein can be determined by running it on the gel in parallel with known Mr standards (Fig. 3-19).
Isoelectric Focusing In isoelectric focusing, proteins are separated according to their isoelectric points (pIs) (Fig. 3-20). A pH gradient is established on a gel strip by allowing a mixture of low molecular weight organic acids and bases (ampholytes) to distribute themselves in an electric field applied across the strip. Proteins migrate on the strip to a point where the pH matches their pIs. At the pI the net charge on a protein is zero, and it stops moving in the electric field.
Two-dimensional Gel Electrophoresis In two-dimensional gel electrophoresis, isoelectric focusing and SDS PAGE are combined to obtain a high resolution separation of a complex mixture of proteins (Fig. 3-21). Proteins are first separated by isoelectric focusing on a gel strip. Then the gel strip is mounted on top of an SDS PAGE gel and separated by electrophoresis in the second dimension. Horizontal separation of spots is based on their pI differences. Vertical separation is based on differences in molecular weights. Thousands of proteins can be separated by this techniques using a single SDS PAGE gel. Individual protein spots can be excised from the gel and identified by mass spectrometry.
Activity vs Specific Activity The purification of an enzyme is measured, or assayed, based on the ability of the protein fraction containing the enzyme to carry out a biochemical reaction. 1.0 unit of enzyme activity is defined as the amount of enzyme causing the transformation of 1.0 mol of substrate to product per minute at 25˚C under optimal conditions of measurement. The term activity reflects the total units of enzyme in a solution. The term specific activity is the number of units of enzyme activity per milligram of total protein (Fig. 3-22). The specific activity is a measure of enzyme purity. It increases during the purification of an enzyme and become maximal and constant when the enzyme is pure (see Table 3-5).
Levels of Structure in Proteins The structure of large molecules such as proteins can be described at four levels of complexity, arranged in a conceptual hierarchy (Fig. 3-23). The primary structure of a protein refers to the sequence of amino acids in the protein, and includes disulfide bonds. The secondary structure refers to local and stable folding elements in the larger structure, such as helices. The tertiary structure refers to the three-dimensional folding and locations of all atoms in the protein. Quaternary structure is reserved for multisubunit proteins. The arrangement in 3D space of all subunits in a protein is its quaternary structure.
Amino Acid Sequence of Bovine Insulin The first protein whose sequence was determined was that of bovine insulin (Fig. 3-24). The British Nobel laureate, Frederick Sanger, oversaw the sequencing of bovine insulin in 1953, the same year that Watson and Crick solved the structure of double-helical DNA. Today, few protein sequences are determined in their entirety by chemical methods, with most being deduced from the DNA sequences of the genes that encode them. However, segments of proteins are often sequenced in the process of gene cloning, and many of the classical steps used in protein sequencing are applied today in the study of protein structure and function. In the next few slides modern methods for protein sequencing by chemical procedures and mass spectrometry are discussed.
Overview of Protein Sequencing The conventional strategy used for chemical sequencing of a protein is summarized in Fig. 3-25. It includes 1) identification of the first residue located at the amino terminus, 2) determination of the complete amino acid composition of the protein, 3) cleavage of the protein into shorter polypeptide fragments that can be sequenced in their entirety, 4) sequencing of each polypeptide fragment, and 5) ordering the polypeptide fragments in the overall sequence of the protein. Each of these steps is covered further in the next few slides.
N-terminal Labeling Reagents The first amino acid residue at the N-terminus of a protein is identified by reaction of the protein with one of the reagents such as FDNB (1-fluoro-2,4-dinitrobenzene) shown in Fig. 3-26. Following labeling the protein is hydrolyzed and the modified N-terminal residue is identified by chromatography. FDNB is also known as Sanger’s reagent. Other more sensitive fluorescent reagents (e.g., dansyl chloride and dabsyl chloride) now are used when working with small quantities of a purified protein. N-terminal labeling also identifies which sequenced polypeptide occurs first in the complete sequence of the protein, as illustrated in Fig. 3-25.
Edman Degradation Sequencing The chemical sequencing process itself is based on a two-step procedure developed by Pehr Edman (Fig. 3-27). The reagent phenylisothiocyanate is used to label the N-terminal residue of the polypeptide, which then is released and identified without damaging the remainder of the polypeptide. Then the process is repeated. About 40 amino acids can be sequenced for each polypeptide. Polypeptides themselves are generated by enzymatic or chemical fragmentation of the starting protein (Fig. 3-25).
Breaking Disulfide Bonds in Proteins In order to obtain isolated polypeptide fragments from a protein for sequencing, disulfide bonds must be broken. Commonly bonds are broken by oxidation with performic acid, or using a two-step procedure in which the bond is first broken by treatment with a reducing agent such as dithiothreitol, and then the free thiols are alkylated by carboxymethylation using iodoacetate (Fig. 3-28).
Methods for Fragmenting Proteins Since at most 40 amino acids at a time can be sequenced by the Edman degradation procedure, large proteins must be fragmented into smaller polypeptides for sequencing. A number of proteases are available for this purpose as are a few chemical cleavage methods (e.g., cyanogen bromide cleavage) (Table 3-6). The selection of a method for cleavage is guided in part by the earlier determination of the total amino acid composition of the protein. The identification of the C-terminal residue in the polypeptide fragments helps in ordering the polypeptides in the overall sequence (see Fig. 3-25). The ordering of the protein sequence also is facilitated by sequencing in parallel a second set of polypeptides generated by another protease. The order in which the fragments appeared in the original protein can then be determined by examining the overlaps in sequence between the two sets of fragments.
Protein Mass spectrometry Mass spectrometry (MS) is a important alternative method to those discussed above, for determining the Mr and sequence of proteins and peptides. Proteins/peptides to be analyzed are first ionized in a vacuum. The ionized polypeptides are then introduced into an electric and/or magnetic field where they are separated according to their mass-to-charge ratios, m/z. After accounting for the total charge of the ionized molecule, its Mr can be accurately determined. Two principal methods of MS, each based on the procedure for introducing ionized polypeptides into a vacuum, are used for protein/peptide analysis. These are matrix-assisted laser desorption/ionization MS (MALDI MS), and electrospray ionization MS (ESI MS). In the first method a sample of protein is applied to a solid support containing a laser-excitable matrix. On illumination with the laser, the ionized protein desorbs from the matrix into the vacuum of the MS instrument. In the ESI MS method, a solution of the protein is passed through a charged needle that is kept at a high electrical potential, dispersing the solution into a fine mist of charged microdroplets. The solvent surrounding the protein evaporates in the vacuum of the spectrometer and the ionized protein is suspended in the gas phase inside the instrument.
Mr Determination by ESI MS The ionization method used in ESI MS is illustrated in the upper part of Fig. 3-30. The spectrum generated for a single protein injected into the instrument is shown in the bottom part of the figure. What is observed is a family of peaks with each successive peak from right to left corresponding to charged species increased by 1 in both mass and charge. The Mr of the protein is calculated by multiplying each m/z peak by its z number and averaging (inset).
Protein Sequencing by Tandem MS The technique called tandem MS, or MS/MS, is commonly used to sequence short stretches of a polypeptide (Fig. 3-31). A protein solution is treated with a protease to produce short polypeptides which are separated in a mass spectrometer (MS-1). The polypeptides are sorted and one is selected for further analysis. After leaving MS-1 it passes through a collision cell where it is cleaved randomly at its peptide bonds by a high energy gas. The second spectrometer (MS-2) separates these peaks by their m/z ratios. The successive peaks differ by the masses of amino acids in the original polypeptide. Peptide sequencing by tandem MS can also be used to detect amino acid modifications in proteins.
Chemical Synthesis of Peptides Many peptides are used in pharmaceutical and other biochemistry applications. It currently is possible to synthesize polypeptides of 100 amino acids or less using the chemical synthesis method shown in Fig. 3-32. In the method, a peptide is built up from its carboxyl terminus after linking this amino acid to a solid support. The blocking group Fmoc (9-fluorenylmethoxycarbonyl) prevents unwanted reactions at the -amino group of each added residue. The chemical dicyclohexylcarbodiimide (DCC) is used to activate -carboxyl groups for peptide bond formation. The synthesis technology is automated.
Yields in Peptide Synthesis An important limitation of the peptide synthesis method is the efficiency of each chemical cycle. In Table 3-7, the overall yields of peptides as a function of length are calculated assuming the step efficiency is 96.0 vs 99.8 %. Incomplete reaction at any step leads to an impurity in the form of a shortened peptide in the final product.
Information Derived from Protein Sequence Analysis The analysis of protein sequences via computer-based tools (bioinformatics) provides a wealth of information about the structure and function of proteins, and the evolutionary relationships between the organisms that synthesize them. A key method in the application of bioinformatics to evolutionary, structure and function analysis are sequence alignments (Fig. 3-33). Sequence alignments of related proteins also reveal consensus sequences that indicate protein function, cell location, chemical modification and prosthetic group binding, and even turnover rates (Box 3-2, next slide).
Bacterial Evolutionary Trees Evolutionary relationships between organisms are revealed by comparing the sequences of fundamental proteins that are present in all organisms. A bacterial evolutionary tree derived from comparison of the sequences of the protein GroEL (a chaperone involved in assisted protein folding) is shown in Fig. 3-35. In such trees, external nodes mark the locations of extant organisms. Internal nodes mark the locations of their last common ancestors. The lengths of lines represent the level of sequence divergence between organisms. Note that comparisons of protein sequence are more reliable than comparisons of DNA sequences for tree construction, since proteins contain 20 amino acids and DNA contains only 4 bases.
Consensus Tree of Life Sequence comparisons of numerous shared proteins and analysis of additional genomic features has been performed to construct the mostly likely general tree of life (Fig. 3-36). Such analysis (and earlier rRNA sequencing by Carl Woese) reveal that all life forms on Earth can be divided into three domains--Bacteria, Archaea, and Eukaryotes. The evolutionary distances of each kingdom to the last universal common ancestor (LUCA) are given by the lengths of the lines in the tree.