Download
1 / 29
290 likes | 372 Vues
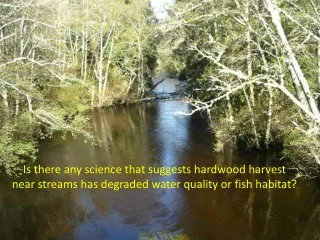
Delve into the impact of forest activities on water quality with insights and limitations from research. Explore sediment sources, road impacts, and delivery pathways.

E N D
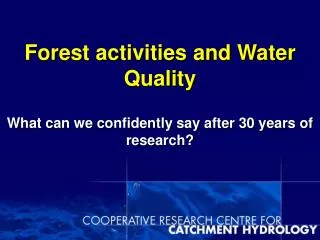
Forest activities and Water Quality What can we confidently say after 30 years of research?
DOES LOGGING IMPACT UPON WATER QUALITY? • $64,000 question that largely remains unanswered • The question itself is not CONSTRUCTIVE - it offers no solution and no practical help to the industry
TRADITIONAL APPROACH • Paired catchment monitored before and after the period of major disturbance. • Estimates of suspended solids or turbidity are used to infer increased sediment delivery to streams
IMPORTANT LIMITATIONS • Black-Box ie you can NOT relate the increase in suspended load at the catchment outlet to activities on the slopes • Tells us nothing about where the sediment comes from and hence how to manage it
NEW APPROACH- OPEN UP THE BLACK BOX For water pollution to occur, you need 3 key ingredients; • a source of sediment, • delivered directly to the stream • complete failure of any sediment control strategies or BMP’s
CAN WE BE CONFIDENT? • BROAD GENERALISATIONS • WELL ESTABLISHED • LIMITED EVIDENCE • SPECULATIVE
SEDIMENT AND NUTRIENT SOURCES Well Established • Unsealed forest roads are the major sources of sediment in managed forests. • Road usage is a critical factor in explaining sediment production rates on roads.
Feeder Access Dump Access Secondary Access 5 yr snig track 100000 (Reid and Dunne 1984) 10000 Heavy use Sediment concentration (mg/L) 1000 Temporary use 100 Abandoned 10 10 100 1000 10000 Culvert discharge (mL/s)
100 10 1 0.1 Road 0.01 Snig Track 0.001 Hillslope 0 500 1000 1500 2000 2500 SEDIMENT SOURCES Sediment Flux (g/m/s) Time (secs)
SEDIMENT AND NUTRIENT SOURCES • Sediment production rates on roads and tracks decline within the time frame of 2- to 5 years • Sediment yeilds from managed forests are lower than those from other landuses primarily agriculture
1.20 Metasediment 0.80 Red Granite 0.40 Light Granite 0.00 0.5 1 2 3 4 5 6 0.5 1 2 3 4 5 6 RECOVERY OVER TIME Snig Track Yield (kg/ m2) Age (years) 0.04 0.03 Hillslope Yield (kg/m2) 0.02 0.01 0.00 Age (years)
SEDIMENT AND NUTRIENT SOURCES • Nutrient concentrations in streams draining forested catchments are considerably lower than those reported for other landuses, primarily agriculture. • The dominant cause of increased nutrients in streams if observed, is due to the effects of prescribed burning and wildfire.
SEDIMENT AND NUTRIENT SOURCES Limited Evidence • The GHA is not a significant source of sediment due to limited sediment availability, high retention of vegetation cover and spatially variable infiltration rates.
Metasediment soil Red granite soil 0.25 0.26 2.31 t/ha 11.08 t/ha xbank 0.69 1.62 0.35 t/ha 0.05 t/ha GHA Snig GHA Snig
SEDIMENT DELIVERY PATHWAYS • The degree to which the source is connected or linked to the receiving waters
Bridge Partial channel linkage Direct linkage Infiltration Full channel linkage No channel linkage
DELIVERY PATHWAYS Well Established • Channelised pathways forming at road drainage outlets form the most efficient conduit for sediment and nutrient delivery to streams. • Sediment delivery ratios are closely associated with the size composition of the in-situ and eroded soil.
100 90 80 70 60 Percentage 50 40 30 20 10 0 Culverts Push Outs Mitres Full Channel Partial Channel CULVERT MITRE DRAIN
N 2km Follow the Red Line Major area of Impact
The impact can be widespread • The impact of channelised pathways extends beyond a single point or particular road drain and can be catchment-wide • They also become permanent features of the landscape
Drain discharge hillslope gradient 2.5 5.0 7.5 10 15 20 25 45 - 0 110 95 90 85 80 75 75 1 155 110 95 90 85 80 75 75 2 155 110 95 90 85 80 75 75 3 150 110 95 90 85 80 75 75 4 125 110 95 90 85 80 75 75 Maximum contributing length 95m for road gradient of 5 degrees and DHG 7.5 5 100 100 90 85 80 75 75 95 6 90 90 90 90 85 80 75 75 Road travelway gradient 7 80 80 80 80 80 80 75 75 8 70 70 70 70 70 70 70 70 9 65 65 65 65 65 65 65 65 10 60 60 60 60 60 60 60 60 11 55 55 55 55 55 55 55 55 12 50 50 50 50 50 50 50 50 13 45 45 45 45 45 45 45 45 14 40 40 40 40 40 40 40 40 15 40 40 40 40 40 40 40 40
2 year event for T = 30mins 200 100 80 60 50 40 30 20 10 year event for T = 30mins 10 8 100 year event for T = 30mins 6 5 5 6 8 10 20 30 40 50 60 80 100 200 Inter-bank length (m)
EFFECTS OF BEST MANAGEMENT PRACTICES Well established • BMP’s play a significant role in the reduction of adverse effects in forested catchments. • Forest buffer strips are an effective measure in reducing the volume of surface water and sediment/nutrients delivered to a stream.
EFFECTS OF BEST MANAGEMENT PRACTICES Limited Evidence • The best location and design of buffer strips in forested catchments of varying topography and landuse. • The specific role and effectiveness of BMP’s on the hillslope compared with those in the near-stream area.
CONCLUDING REMARKS • The Most Dramatic Impacts On Water Quality Will Come About In Response To The Most Dramatic Landuse Impact- • Broad Scale Slash And Burn- Large Scale Conversion To Pasture