C HAPTER 7
C HAPTER 7. E NVIRONMENTAL PERFORMANCE EVALUATION. Ideas for the Chapter. Variety of methodologies that may be employed at different design stages will be discussed in this chapter : Section A : Tier 1 Environmental Performance Tools Section B : Tier 2 Environmental Performance Tools

C HAPTER 7
E N D
Presentation Transcript
CHAPTER 7 ENVIRONMENTAL PERFORMANCE EVALUATION
Ideas for the Chapter Variety of methodologies that may be employed at different design stages will be discussed in this chapter : Section A : Tier 1 Environmental Performance Tools Section B : Tier 2 Environmental Performance Tools Introduction to Tier 3 Environmental Performance Tools.
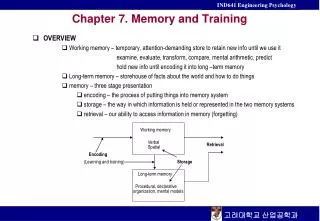
Environmental Performance Evaluation (EPE) – Goals An internal management process that provides information to facilitate management decisions regarding an organization’s environmental performance Supported by ISO 14001 – Environmental management systems – Specifications with guidance for use, 1996, 2003. By means of the tool ISO/TC 207/SC 4 - develops international guidance on EPE, and, ISO 14031 – Environmental management – Environmental performance evaluation – Guidelines, 1999 ISO/TR 14032 – Environmental management - Examples of EPE, 1999
ENVIRONMENTAL AUDITING 14010 SERIES (19011) LIFE CYCLE ASSESSMENT 14040 SÉRIES ENVIRONMENTAL MANAGEMENT SYSTEMS ISO 14001/ 4 ENVIROMENTAL LABELLING 14020 SERIES ENVIRONMENTAL PERFORMANCE EVALUATION 14030 SERIES DESIGN FOR ENVIRONMENT TR 14062 FOCUS: Organizations FOCUS: Product The EPE in context of the ISO 14000 Series: Environmental Management NEW ITEM: ENVIRONMENTAL COMMUNICATION( TR 14063)
Objectives and Benefits of an EPE Program • Better understanding of an organization’s impacts on the environment, • Providing a basis for benchmarking management, operational and environmental performance, • Identifying opportunities for improving efficiency of energy and resource usage, • Determining whether environmental objectives and targets are being met, • Demonstrating compliance with regulations, • Determining proper allocation of resources, • Increasing the awareness of employees, and, • Improving community and customer relations
Environmental performance indicators (EPIs) Management performance indicators (MPIs):policy, people, planning activities, practice, procedures, decisions and actions in the organization Operational performance indicators (OPIs):inputs, the supply of inputs, the design, installation, operation and maintenance of the physical facilities and equipment, outputs and their delivery Environmental condition indicators (ECIs) Provide information about the local, regional, national or global condition of the environment INTEREST: Help an organization to better understand the actual impact or potential impact of its environmental aspects and assist in the planning and implementation of the EPE EPE Indicators
Plan Objective: Selection of indicators based on significant environmental aspects Environmental performance criteria (internal and regulatory) Views of interested parties (business plan) Indicators: ECI, EPI, MPI and OPI (see table for examples) Do – assessing performance Collecting data -regulations, operating permits, EMS procedures and records, reports government agencies (production, process, monitoring), environmental budgets, chemical inventories, storage tanks and spill records. Converting data to information Evaluating the information Communicating the results Plan-Do-Check-Act Model: ISO 14031....
Plan-Do-Check-Act Model: ISO 14031.... • Check and Act – reviewing and improving performance • Objective: To identify opportunities for improving environmental performance including • Program cost and benefit • Progress towards meeting environmental performance targets • How appropriate are the environmental performance criteria and indicators • Data quality and collection methods Case study1 Implementation of EPE at Mother Dairy Fruit and Vegetable Ltd., New Delhi, India, 2001 Problem: the dairy was monitoring liquid fuel and electric power consumption together with the volume of wastewater processed in the effluent treatment system EPE strategy: all parameters were normalized using the volume of milk processed Results: the dairy increased the amount of milk processed per unit of electrical power (23%) an diesel fuel consumed (38%) and reductions of wastewater generated (20%)
Example of EPE’s application: Measuring Environmental Performance of Industry (MEPI) Project in Europe MEPI’s Objective: the improvement of internal and external transparency about the effects on the environment and responses to mitigate them MEPI’s Tools: Environmental Performance Indicators – physical, business and environmental impact MEPI’s Focus: materials and energy use and waste emissions at the level of plant and firm
Tools (indicators) in the MEPI Project MEPI’s indicators include: generic (Table) and sector - specific
Most significant variables influencing environmental performance in the Paper, Fertiliser and Electricity Industry in European Countries Numbers in parenthesis indicate available cases of the total (n)
Environmental Performance Main Tools • Economic Criteria • Environmental Criteria (Persistence and Bioaccumulation) • Toxicity Criteria and Weighting • Evaluating Alternative Synthetic Pathways
Design Synthesis Steps • Input and Output Structures Known • Chemical Structures are Known • Many Alternative Pathways Exist
Economic Criteria Estimate the cost of raw materials versus the value and/or cost of byproducts and products. The cost of the various options can be estimated by: This is more of a qualitative analysis because it does not take into account other potential costs associated with the production of the given substance (i.e. higher temperatures require more energy, etc).
Environmental Criteria • It only takes into account the substances’ Persistent, Toxic and Bioaccumulating properties. • Persistence and Bioaccumulation are easily estimated and a table shows rating index values on the following slide.
Rating Index (RI) Source : Green Engineering text, Allen and Shonnard, pp. 204
Toxicity Evaluations • Threshold Limit Values (TLVs) : • Definition : Airborne concentration limit for individual exposures • in a workplace environment. • Established by : ACGIH -http://www.acgih.org • Permissible Exposure Limits (PELs) : • Definition : similar to TLV ; represents the legal implications in defining workplace conditions. • Established by : OSHA -http://www.osha.gov/ • Recommended Exposure Limits (RELs) : • Definition : more current then PELs ; solely based on toxicity research. • Established by : NIOSH -http://www.cdc.gov/niosh/homepage.html
Toxicity Index One Toxicity Index can be calculated using : Source : Green Engineering, Allen and Shonnard, pp 205.
Toxicity Weighting • Taking into account ingestion pathways : • - Inhalation Reference Concentration • - Oral Ingestion Slope Factor • - Unit Risk • - IRIS database is one source of data : http://www.epa.gov/ngispgm3/iris/subst/index.html
The toxic weighting factor (Ftox) represents the “weight” to be given to each substance to make possible the comparison of the discharges. The toxic weighting factor is defined as the inverse of the most stringent water quality criterion for each substance (MSCi): Ftox i = 1/MSCi MSCi = min (CTACi, CCOAi) This is a dimensionless number, and represents the toxic potential to be assigned to a given pollutant to evaluate its relative importance in the discharges. Source: http://www.slv2000.qc.ca/plan_action/phase1/chimiotox_a.pdf
Evaluating Alternative Synthetic Pathways • A general Composite Index of the overall input-output structure can be established with the substance’s PBT properties and can also rely on the emission rates.
Methods of applying Weighting Factors : • 1) Toxicity as Weighting Factor. • 2) US EPA Toxicity Approach. • 3) Using PBT Weighting Factors.
Tier 2 :Environmental Performance Tools Topics covered in this section: • Environmental Release Assessment • Release Quantification Methods • Modeled Release Estimates • Release Characterization and Documentation • Assessing Environmental Performance
Design Synthesis Steps Basic information needed • Preliminary Process Flowsheets. • Basic Knowledge of Unit Operations. • Rough Estimate of Unit Operation Sizing.
Environmental Release Assessment Necessary Knowledge about Releases • Environment includes : • - Water - Air - Land • Releases may include : • Spilling - Leaking - Pumping • Pouring - Emitting - Emptying • Discharging - Injecting - Escaping • Leaching - Dumping into the environment • Disposing into the environment
Release Assessment Components Obtain/Diagram A process Flowsheet Identify Purpose and Need for Release Assessment Identify and List Waste and Emission Streams (WESs) Determine Additional WESs Determine best method for quantifying the release rate of each WES Determinedata/info needed to use the methods determined Quantify chemical’s release rates + frequencies + the media in which it is released Document release assessment; include characterization of estimate uncertainties Collect data + info to fill in the gaps
Process Analysis • When analyzing flowsheets, account for missing releases that include : • Fugitive Emissions (which include leaks). • Venting of Equipment (including breathing and displacement losses). • Periodic Equipment Cleaning (frequent and infrequent). • Transport Container Residuals (including drums, totes, tank trucks, rail cars and barges). • Incomplete Separations (including destilation, gravity phase separation and filtration).
Process Analysis... continues • Determining the manner in which substances are released is crucial in assessing environmental impacts • Releases can also occur on and off site, including : • - Air : include primary and secondary emissions. • - Water : transfers into streams or water bodies. • - Underground Injection : generally into wells. • - Land : within the boundaries of the facility.
Air: Primary Emissions Stacks Emissions There are different dispersion patterns to high-stack (over 75 meters), medium-stack (25 meters–75 meters) and low-stack sources (less than 25 meters). High-stack sources are synonymous with modern power plants; medium-stack sources with large industrial plants, district heating plants, and suboptimal power utilities; and low-stack, or low-level, sources with small industrial and commercial users, transport, and the domestic sector. Source: http://lnweb18.worldbank.org/SAR/sa.nsf/Attachments/FFCh2/$File/FFCh2.pdf
Air: Secondary Emissions Fugitive Emissions The sources of fugitive emissions are categorized as (1) industrial processes, operations, activities, or materials that emit particulate or chemical pollutants or (2) activities or operations that create fugitive dust. Particulates that become airborne by wind and/or human activity are also referred to as fugitive dust. Source: http://www.seattle.battelle.org/forscom/Hot_Air/Fugitive.htm
Release Quantification Methods 1. Measured release data for the chemical or indirectly measured release data using mass balance or stoichiometric ratios. 2. Release data for a surrogate chemical with similar release-affecting properties and used in the same (or very similar) process. Surrogate data may be measured, indirectly measured, modeled or some combination of these. Some emission factors would be considered to be surrogate data.
3. Modeled release estimates : a. Mathematically modeled (eg) release estimates for the chemical or by analogy to a surrogate chemical. b. Rule of thumb release estimates, or those being developed using engineering judgement.
Measured Release Data for the Chemical • Usually only applicable for actual processes • For a continuous process : • Can also be estimated using the chemical’s weight fraction and the mass flowrate of the release stream
Release Data for a Surrogate Chemical • By using surrogate chemical data, it should be ensured that there exist similarities in some physical/chemical properties of the chemicals, unit ops and their operating conditions and quantities of chemical throughput.
Emission Factors - Usually only used for Air Emissions. - Many databases exist containing these factors.
A. Average Marginal CO2 Emissions Factors for Electricity Generation by EPA Region (2000): Source: http://www.epa.gov/appdstar/pdf/brochure.pdf
B. CO2 Emission Factors by Fuel Type per Unit Volume, Mass, and Energy: Source: http://www.epa.gov/appdstar/pdf/brochure.pdf
Emissions from Process Units and Fugitive Sources • Equation for Rate of Emission : • Where : • mvoc is the mass fraction of the VOC in the stream or process unit, • EFav is the average emissions factor ascribed to the stream or process unit (kg emitted/103kg throughput), • M is the mass flow rate through the unit (mass/time). • See tables with lists of various factors examples.
Losses of Residuals from Cleaning of Drums and Tanks • Nature of the cleaning process should be considered • Capacities. • Shapes. • Materials of construction of the vessels to be cleaned. • Cleaning schedule. • The residual quantity of the chemical in the vessels. • The type and amount of solvent used (aq. Vs. Organic). • Solubility/miscibility of the chemical in the solvent. • If applicable, treatment of wastewater containing the chemical.
Secondary Emissions from Utility Sources • Utility use is extensive in causing environmental impact. • Emission estimation equations : • Where: • ED is the energy demand of a process unit • (energy demand/unit/yr). • EF is the emission factor for the fuel type • (kg/volume of fuel combusted). • FV is the fuel value (energy/volume fuel combusted). • BE is the boiler efficiency (unitless; 0.75-0.9 typical values).
Where: • ED is the electricity demand of a process unit • (energy demand/unit/yr). • EF is the emission factor for the fuel type • (kg/volume of fuel combusted). • ME is the efficiency of the device.
Modeled Release Estimates • Process design software account for some releases, but not all. The following slides will introduce information that allows the calculation of the missed releases : • - Loading transport containers • - Evaporative losses from static liquid pools • - Storage tank working and breathing loss.
Loading Transport Containers • Quantity of evaporative losses from a loading container is a function of : • - Physical and chemical characteristics of the previous cargo • - Method of unloading the previous cargo • - Operations to transport the empty carrier to a loading terminal • - Method of loading the new cargo • - Physical and chemical characteristics of the new cargo
Evaporative Losses from Static Liquid Pools • - Evaporation Rate : • Where : • G is the generation rate (lb/hr), • M is the molecular weight (lb/lb mole), • P is the vapor pressure (in Hg), • A is the area (ft2), • Dab is the diffusion coefficient (ft2/s of a through b is air), • Vz is the air velocity (ft/min), • T is the temperature (K), • Δz is the pool lenght along flow direction (ft).
- Diffusion Coefficient Where the units are : Dab (cm2/s), M (g/gmole), Pt(atm), T (K).