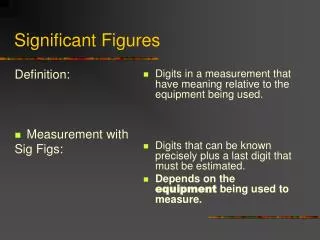
Significant Figures
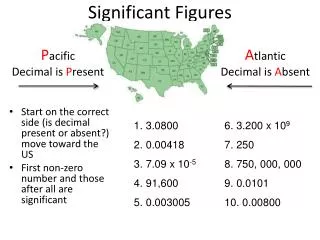
Significant Figures. Start on the correct side (is decimal present or absent?) move toward the US First non-zero number and those after all are significant. P acific Decimal is P resent. A tlantic Decimal is A bsent. 3.0800 0.00418 7.09 x 10 -5 91,600 0.003005 .

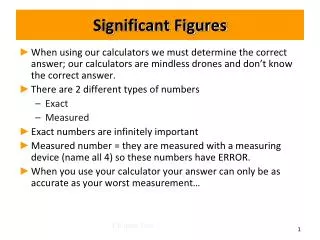
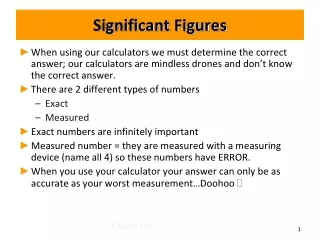
Significant Figures
E N D
Presentation Transcript
Significant Figures • Start on the correct side (is decimal present or absent?) move toward the US • First non-zero number and those after all are significant Pacific Decimal is Present Atlantic Decimal is Absent • 3.0800 • 0.00418 • 7.09 x 10⁻⁵ • 91,600 • 0.003005 6. 3.200 x 10⁹ 7. 250 8. 750, 000, 000 9. 0.0101 10. 0.00800
Sig Figs • Multiplying and Dividing • Answer must have same number of significant figures as the measurement with the fewest significant figures 3.20 * 3.65 * 2.05 = 23.944 = 23.9 24 * 3.26 = 78.24 = 78 120 * 0.10 = 12.000 = 12 4.84 ÷ 2.4 = 2.016 = 2.0 168 ÷ 58 = 2.8965 = 2.9
Sig Figs • Adding and Subtracting • Answer must have same # of digits to the right of decimal as the value w/ the fewest digits to the right of decimal (4.32*103) – (1.6*103) = 2.72*103 = 2.7 * 103 28.0 23.538 + 25.68 77.218 = 77.2
Scientific Notation • Convenient way of writing very small or large numbers • Consists of two parts • Number & ten raised to an exponent • Exponent is negative, number will be smaller than 1 • Exponent is positive, number will be bigger than 1 0.000 000 000 000 000 000 000 162 378 1.62 x 10 -22 136,392,412,792 1.36 x 10¹¹
47,800 0.0035 573 9256 5. 26.23 6. 0.23 7. 0.00036 8. 0.0000501
9. 4.2 x 10³ 10 1.12 x 10² 1.02 x 101 2.5 x10⁷ 2.05 x 10⁻³ 4.5 x10⁻⁵ 1.002 x 10⁸ 1.002 x 10⁻⁴
Scientific Notation • Multiplying • Multiply the first factors • Add the exponents (2*103) * (3*103) = 6*106 (4*106) * (2*10-4) = 8*102 • Dividing • Divide the first factors • Subtract the exponents (6*104) ÷ (3*102) = 2*102 (9*103) ÷ (3*10-4) = 3*107 (3- (-4)) = 3+4
6.25 x10⁻⁴ / 4.1 x101 • 4.18 x10⁻² / 2.4 x10⁻² • 3.24 x10⁻⁴ / 4.8 x10⁻² • 4.1 x103 x 5.2 x 10-4 • 5.24 x 106 x 6.76 x 102 • 2.3 x 103 x 9.8 x 10-4
Scientific Notation • Adding and Subtracting • Exponents MUST BE THE SAME before doing the math! • Add the numbers and rewrite x10exponent (2.7*107) + (1.56*105) (270*105) +(1.56*105) = 271.56*105 = 2.7 * 107 (8.3*108) – (4.1*106) (830*106) – (4.1*106) = 825.9 *106 = 8.3 *108
0.0256 + 0.0032 • 4.1 x10⁵ – 2.8 x 10² • 3.1 x10⁵ + 5.2 x10³
84791 kg 36.8152 g 226.85 cm 5.1676 m WebAssignrounding sig figsRound to four sig figs
Graphs • Visual display of data
Setting up the Graph Adjust your scale to ensure the graph occupies the most space Your values need to increase at a steady rate (for example count by 2)
Setting up the graph… • Y axis • Always on vertical axis • Always dependent variable • X axis • Always on horizontal axis • Always independent variable
Which is dependent variable? • Amount of fertilizer • Growth rate of plants • Number of years • Increase in population • Inches of rain that fell • Month rainfall occurred • Amount due on cell phone bill • Minutes used
Interpolation • Finding an unknown point between 2 measured points B C A
Extrapolation • Finding an unknown point that is outside of 2 measured points B C A
Best fit line • line that averages the data points • DOES NOT MEAN CONNECT THE POINTS