Standard Deviation in AP Biology Lab Analysis
70 likes | 119 Vues
Learn why standard deviation is crucial in analyzing lab results & master the formula and steps for calculation. Explore helpful resources like mathisfun.com and Youtube tutorials.

Standard Deviation in AP Biology Lab Analysis
E N D
Presentation Transcript
Why would we use the standard deviation to analyze our lab result? • In statistics and probability theory,standard deviation (represented bythe symbol σ ) shows how muchvariation or " dispersion " exists fromthe average (mean, or expected value) • A low standard deviation (less than 2) indicatesthat the data points tend to be very close to the mean, whereas highstandard deviation (greater than 2) indicates that the data points are spread out over alarge range of values.
What is the formula for standard deviation? Note: since our data is a sample, not a population, we will use n-1 and not just n for our denominator.
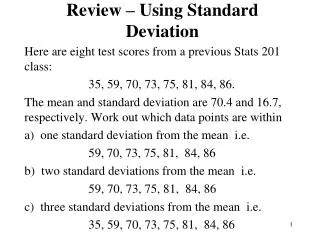
What are the basic steps? • Step 1-Find the mean of the data (in other words, take an average of all your data points) • Step 2-Subtract the mean from each data point • Step 3- Square of the values you got in step 2 • Step 4-Subtract 1 from the number of data points you used in step 1. • Step 5- Divide your answer in step 3 by your answer in step 4. • Step 6 -Find the square root of the answer you got in step 5.
Fun with standard deviation! • Click on this website to access mathisfun.com Use the standard deviation calculator on this website to try your hand at standard deviation problems!!
Watch this video to give you the basic steps in calculating standard deviation: http://www.youtube.com/watch?v=klP8ElkVxJk This video gives two ways to calculate standard deviation (the computational formula is a little less work) http://www.youtube.com/watch?v=_x-XWDEIhfE Watch this one to help you do standard deviation on a calculator: http://www.youtube.com/watch?v=DMOXzwC2vzg Watch this one on using microsoft excel to calculate mean, variance and standard deviation: http://www.youtube.com/watch?v=efdRmGqCYBk Youtube videos which help explain how to do standard deviation:
How to use your calculator to compute standard deviation • Click on 2nd Stat button (above Data) • Hit right arrow button. You will see 1-var. This will help you get the standard deviation of a sample. • Hit enter • Hit Data • When you see X1 submit your first data point. Hit enter • Then hit down arrow. • Your will see FRQ- Enter how many times the same data point shows up in your results. • Hit enter. • Use the down arrow. You will see X2. Submit your next data point. Hit enter. • When frequency shows up, enter the number of times that data point shows up in your results. Hit enter. • After all data points and their frequency are entered, hit stat/var button on your calculator. • Use the right arrow to display mean and standard deviation.