Roadmap for the Underprepared:
Roadmap for the Underprepared:. Creating Success Highways by Institutionalizing Early Interventions. The Road Crew…. Joan Kindle , Associate Provost Kimberley Polly , Mathematics Instructor Laura LaBauve , Associate Dean Multicultural Learning Kathi Nevels ,

Roadmap for the Underprepared:
E N D
Presentation Transcript
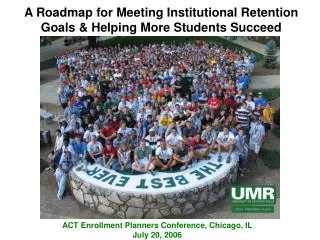
Roadmap for the Underprepared: Creating Success Highways by Institutionalizing Early Interventions
The Road Crew… • Joan Kindle, Associate Provost • Kimberley Polly, Mathematics Instructor • Laura LaBauve, Associate Dean Multicultural Learning • Kathi Nevels, Student Development Professor
Today’s Map… • Harper College Context • Overview of Three Intervention Pathways for the Underprepared • High School/Community College Partnership • REACH Summer Bridge Program • Project Success: Early Intervention • Value of Integration and Institutionalization— • Discussion and Questions
Harper College Demographics • Credit Headcount = 17,000 • Full time Equivalent = 10,170 • Caucasian = 58% • Female = 56% • Developmental Math = 43% • Developmental English = 15% • Developmental Reading = 18% • High School Headcount = 28,000 • High School Graduates = 6,600 • % Graduates Enroll at Harper = 35%
Beginning the Student Success Journey • Joined ATD in 2009 • Achievement Gaps: • Developmental Ed • Developmental Math • African American Students • New President 2009 • New Strategic Plan 2010- Building Community Through Student Success • Northwest Educational Council for Student Success 2010 • Merged Academic and Student Affairs 2010
The Result….. • Bringing all units across the college and the district together to build a new, proactive and more personalized pathway from high school to Harper and through Harper to graduation.
Mathematics Partnership… • Why did we do this? • Shared data opened doors for communication. • Districts were not aware that about 56% of their graduates who came to us were placing into developmental math. • Districts were not aware that there existing “catch-all” senior math course had the wrong topics. • Districts were not aware that about 1/3 of their graduates were coming to Harper. • Common Core.
Mathematics Partnership…How did we start? Harper and District 211 begin COMPASS testing of high school juniors
Mathematics Partnership… • Course Alignment Begins • Project to align high school algebra 2 and Harper’s intermediate algebra. • Shared syllabi and final exams. • Math faculty from all 12 feeder high schools and Harper jointly write a test bank for a common final (for high school and Harper students.) Common final given in May 2012. • Results helped to foster more communication.
Mathematics Partnership… • Need math senior year
Mathematics Partnership… • Used Compass math test in junior year to encourage senior math enrollment
Mathematics Partnership… • Need developmental math option for senior year. • Many students have “passed” high school algebra 1, geometry and algebra 2 but do not meet requirements for AP or dual credit coursework senior year. • New senior math course created. Replaced high school trig/stat class with Harper’s MTH080 class. • Only 4 trig questions on ACT out of 60 questions.
Mathematics Partnership… • 1st Check: Freshmen Year • Communicate to parents that their child will need 4 years of high school math. • In 1973, 72% of jobs required a high school diploma or less. That dropped to 41% in 2007 and is projected to drop to 38% in 2018. • Many certificate and 2-year programs require some sort of math competency.
Mathematics Partnership… • 2nd Check: Junior Year End • Look at multiple measures • ACT math score • Compass placement score • MTH080 final exam score • Place in correct senior math • Upper STEM: AP Calc • Upper Non-STEM: AP Stats • STEM: dual credit MTH103 • Non-STEM: dual credit MTH101 (Quant Lit) • Those not ready: MTH080
Mathematics Partnership… • 3rd Check: Senior Mid-Year • Over 90% of the district seniors are enrolling in senior math, but completion rates are a concern. • Intervention needed with student, counselor and parent(s). • Not successfully completing a math course senior year costs time and money. MTH060 + MTH080 + repeat = $1470. • Waste 3 semesters getting to college-level math and many never get there when they have to repeat high school-level coursework. • Of those students who start in the lowest 2 developmental math classes, only about 14% make it out of developmental math.
Mathematics Partnership… • 4th Check: End of Senior Year for those taking MTH080 and going to Harper after graduation • If they pass the MTH080 final, they are told to register right away for a college-level math course. • If they do not pass the MTH080 final, they are given access to MyMathTest to help prep for the Compass placement exam. • 7% increase in college-level math • 11% decrease in the lowest developmental math class (050 level classes)
REACH Summer Bridge… Student Profile • Two developmental courses or a sequence of developmental courses • Emphasis on students of color Program • Intensive, two-week program • Pre and Post COMPASS exam • 6 cohorts grouped by math level • Academic workshops by faculty • Math, Reading and Writing • Workshops by counselors • Personal, financial and social issues associated with attending college
REACH Summer Bridge… Desired Outcomes: Improve placement scores Overall performance: • 11% tested into ALL college-level courses • 34% tested into at least one college-level course • 80% increased placement scores in at least one area Content area performance: • 26% tested OUT of Reading • 32% tested into college-level ENG101 • 11% tested into a college-level Math course
REACH Summer Bridge… Desired Outcomes: Increase the number of students who immediately start the developmental sequence. • 98% testing into developmental RDG began the sequence (ATD comparison group - 60%) • 73% testing into developmental ENG began the sequence (ATD comparison group - 54%) • 86% testing into developmental MTH began the sequence (ATD comparison group - 43%)
REACH Summer Bridge… Desired Outcomes: Increase the success rate of students who enroll in developmental courses. • 90% of students taking a developmental RDG099course successfully completed (ATD comparison group – 62%) • 53% of students taking a developmental ENG100course successfully completed (ATD comparison group – 60%) • 48% of students taking a developmental MTH080course successfully completed. (ATD comparison group – 22%)
REACH Summer Bridge… Desired Outcomes: Increase the progression of developmental students through the developmental sequence. • 64% of students successfully completing RDG090enrolled in RDG099 (ATD comparison group – 47%) • 88% of students successfully completing ENG098enrolled in ENG100 (ATD comparison group – 39%) • 80% of students successfully completing MTH050 enrolled in MTH060 (ATD comparison group – 72%) • 60% of students successfully completing MTH060 enrolled in MTH080 (ATD comparison group – 67%)
REACH Summer Bridge… Desired Outcomes:Success and Persistence • 64% of the REACH students obtained a 2.0 or higher Fall GPA (ATD comparison group - 45%) • The Fall to Spring persistence rate of REACH students - 80% (Institutional average is 73.1%)
REACH Summer Bridge… Desired Outcomes: Increase student engagement with & understanding of college • 97% more familiar with campus resources • 97%could identify reasons for being in college • 89%felt a sense of community and belonging • 97%understood Harper’s educational policies and procedures
REACH Summer Bridge… Institutionalization • Growth of Student Cohort • from a 34 student pilot to 125 students • Scaling to 225 – meeting the needs of district high schools • Expanding to integrate with the high schools-- reach juniors • Incremental Growth Model • Manage cohort size • Increase faculty involvement • Facility management • Incremental budget requests
REACH Summer Bridge… Transformation • From Summer to Fall • Fall enrollment in First Year Seminar • time management; study skills; career planning; and transfer/educational Planning • Math, Reading, English ‘mini’ cohorts • Learning Communities • Mandatory Meetings with Counselors – Case Management • Tracking students during Spring semester and beyond • Involvement in Early Alert
Project Success: Early Alert… • Target Population • First-year students who are recent high school graduates • Place and enroll in two or more developmental courses or levels of developmental courses • Approximately 800 – 900 identified • 335 students chosen for Fall 2011 Pilot
Project Success: Results • Pilot students persisted Fall-to-Spring at a higher rate than students in the Control Group • 80% for Pilot students; 77.2% for Control Group • Pilot students had a higher Completer Success Rate for All Courses than students in the Control Group • 60.6% for Pilot students; 58.4% for Control Group • Pilot students overall had a slightly higher Completer Success Rate for Developmental Courses than students in the Control Group • 62% for Pilot students; 61% for Control Group
Project Success: Results • More pronounced positive results when compare students who saw counselors vs. those who did not • Fall-to-Spring Persistence
Project Success: Results Completer Success Rate – All Courses • Completer Success Rate – Developmental Courses
Project Success: Lessons Learned • What worked… • Faculty Participation - Liaison • Project Success Specialist • Counselor – Student Appointment • What we changed for 2012/2013 Pilot… • Pre-assign counselors to all pilot students • Include all REACH students • Monitor for the full year • Revise survey timing: 1) Weeks 4-6 and 2) Week 11 • Add faculty referrals to academic support services • Use “Kudos” feature in Starfish
Awarded more than 4,400 degrees and certificates for FY2012, an increase of more than 600 from last year.
Thank You!! Joan Kindle jkindle@harpercollege.edu Kimberley Polly kpolly@harpercollege.edu Laura LaBauve llabauve@harpercollege.edu Kathi Nevels knevels@harpercollege.edu