Download
1 / 27
290 likes | 485 Vues
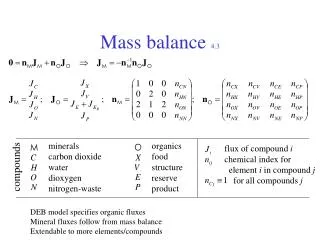
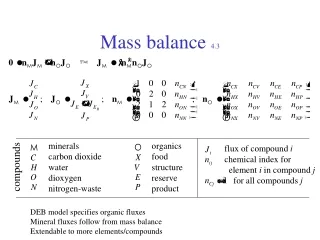
Radiocarbon Mass Balance for a Magnox Nuclear Power Station. Martin Metcalfe International Nuclear Graphite Specialists Meeting, Seattle, 16-18 September 2013. Contents of presentation. Background C-14 production C-14 monitoring on Magnox plant Mass balance model Activation modelling

E N D
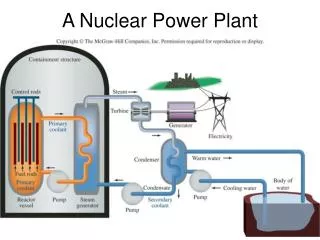
Radiocarbon Mass Balance for a Magnox Nuclear Power Station Martin Metcalfe International Nuclear Graphite Specialists Meeting, Seattle, 16-18 September 2013
Contents of presentation Background C-14 production C-14 monitoring on Magnox plant Mass balance model Activation modelling Carbon mass loss from core and C-14 release C-14 production from gas coolant Mass balance Conclusions
Background Nothing new about estimation of C-14 inventories in nuclear plant. Some excellent references in the open literature on origin of C-14. Current work recognises that fundamental processes are common to all reactor types, but C-14 pathways and C-14 inventories must be assessed by reactor type and often by individual reactor. Work presented here relates to Magnox reactors, with focus on Wylfa. Objective: mass balance analysis to identify key factors determining C-14 inventory with supporting experimental work to inform analysis.
C-14 production Produced in the atmosphere by the capture of thermal neutrons produced from cosmic rays by nitrogen atoms (specifically N-14). Produced through thermal neutron capture on naturally occurring isotopes of carbon (C-13) and oxygen (O-17). N-14 + n —› C-14 + p C-13 + n —› C-14 + γ O-17 + n —› C-14 + α No contribution to C-14 levels in Magnox reactor graphite from C-14 in the atmosphere - any C-14 would have been fixed and have decayed. C-14 in irradiated graphite will come from N-14, C-13 and O-17 impurities.
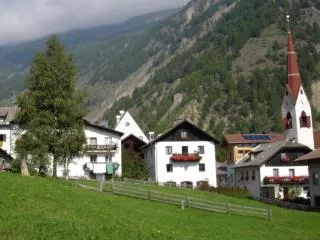
Monitoring C-14 emissions from Magnox stations Wylfa Reactor 1
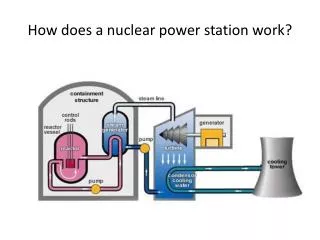
Mass balance model Consider two systems: Graphite core Coolant circuits Graphite core model provides an input term for the coolant circuits model. The graphite core model can be validated against measurements. The coolant circuits model can be validated against recorded station discharge data.
Mass balance model – coolant circuits Taken from “Life cycle and management of Carbon-14 from nuclear power generation”, Yim, M-S and Caron, F, Progress in nuclear energy 48, 2006
Prediction of C-14 production in graphite by activation modelling Non-deterministic reactor physics code for modelling the behaviour of complex reactor geometries MCNPX MCNPX2FIS FISsion Product INventory(FISPIN) NNL processing code to convert 172 group MCNP flux tallys to FISPIN libraries using TRAIL nuclear data to FISPIN cross-section Standard UK Spent Nuclear Fuel inventory code for determining the irradiated nuclide inventory as a function of reactor power, initial enrichment, irradiation and cooling time (by solving the Bateman equations)
Modelling Magnox reactor graphite activation • 3D neutronic solution for the entire height of core with reflecting boundaries • Run for specific sampling positions in the core and also to generate 3D maps of radionuclide build-up • Fuel burn-up and replacement of fuel elements • Graphite oxidation (weight loss) during irradiation • Impurities and activation products immobile • Verified against 2D WIMS calculations
Activation calculations for specific Magnox reactor specimens • Full radionuclide fingerprints measured on 4 Magnox reactor specimens: 2 from Oldbury and 2 from Wylfa with known irradiation history. • Specimens taken from installed carrier assemblies located in interstitial channel positions • One Wylfa specimen skimmed prior to measurement (0.2 mm from surface)
Contributions to C-14 inventory from C-13 and N-14 Measurements with estimated N from model C14 from natural C13 Model predictions for N=0,10 wppm
Estimation of C-14 release from graphite by radiolytic oxidation Estimate carbon mass loss increment over selected period using one of three methods: using core monitoring data at start and end of period from oxidation model predictions from oxidation product carbon monoxide Combined with average C-14 activity from activation modelling supported by measurements on core material
Mass loss from core monitoring data Based on density measurements on samples trepanned in the core in 2009 and 2011. Axial and radial flux shapes used to evaluate core average. Weight loss increment is small (~2% at peak weight loss position) and increment average for whole core will be highly inaccurate. Based on start-of-life mass of the core of 3545 t, mass loss of carbon between the two outages evaluated as 7.7 t. Interstitial channel graphite weight loss data for the Wylfa reactor 1 core at 2009 and 2011
Mass loss predicted from oxidation model Based on an empirical oxidation model that uses the entire core monitoring database for the reactor that gives predictions for a column of bricks in the flattened region. Advantage that predictions are not biased by density data for a relatively small sample population. However, mass loss increment remains small and core averaging based upon radial form factors contains uncertainties. Based on start-of-life mass of the core of 3545 t, mass loss of carbon between the two outages evaluated as 25.9 t. These two approaches give estimates of 7.7 t and 25.9 t, which are not in particularly good agreement (0.22% and 0.73%).
Mass loss predicted from carbon monoxide production Carbon (either as graphite or carbonaceous deposit) is released as carbon monoxide (CO) through its reaction with carbon dioxide. The station operators continuously monitor the gas coolant composition, CO2 losses from the gas circuits (from leakage and purging) and the oxygen feed to the recombination unit (controlling CO).
Mass loss predicted from carbon monoxide production Carbon (either as graphite or carbonaceous deposit) is released as carbon monoxide (CO) through its reaction with carbon dioxide. The station operators continuously monitor the gas coolant composition, CO2 losses from the gas circuits (from leakage and purging) and the oxygen feed to the recombination unit (controlling CO). Based upon CO mass balance, mass loss of carbon between the two outages evaluated as 16.8 t (0.47%). This gives an estimate mid-way between the density difference approaches and will be significantly more accurate as it is based upon easily measurable parameters.
Estimation of C-14 production from the gas coolant Reactor contains 235 t of circulating CO2. Same activation model can be applied to the coolant (N, O, C). Gas volumes within the pores of the graphite and in the voids around graphite components within the active core must be quantified (32.6 t). As with graphite, assumptions concerning impurity levels need to be made. Pure CO2 and CO2 with maximum measured impurities were investigated. C-14 production rate calculated in GBq per day per tonne of coolant (in the defined volumes) per MW(thermal). For selected operating period between 2009 and 2011, between 257 and 281 GBq C-14 produced.
Mass balance C-14 activity=9.55E04 Bq g-1 at 6 metre axial position in the flattened region, based upon 10wppm N impurity. This value representative of a large central volume of the core where the radial and axial flux shapes are broadly flat. All significant radiolytic oxidation occurs in this same region of the core. Total C-14 activity released core is 1604 GBq. Total C-14 activity generated within coolant is 257-281 GBq. Total C-14 production over selected period is ~1870 GBq. Total measured C-14 activity released from reactor is 1790 GBq. Agreement to within 5% between model and measurement.
Conclusions (1) Predictions of C-14 activity in Wylfa graphite based upon activation modelling were broadly in agreement with historical measurements with a nitrogen impurity level of ~10 wppm. In this case, the dominant C-14 precursor is C-13. An average C-14 activity appropriate to carbon gasified from the core by radiolytic oxidation over the selected period is 9.55E04 GBq g-1. The mass of carbon released from the core over this same period has been estimated from a carbon monoxide mass balance. Predictions of C-14 activity in the gas coolant have been made using the same activation model. The mass balance model predicts a release of C-14 from the reactor dominated by production from the graphite.
Conclusions (2) The mass balance prediction is within 5% of the reported C-14 discharge from Wylfa reactor 1 based upon analysis for a two-year operational period. Care should be taken in applying the findings of this analysis to other Magnox reactors and particularly to other reactor types. The analysis highlights the sensitivity of predictions to nitrogen content of the graphite. The analysis indicates that quantifying C-14 levels in graphite cores will require extensive measurement in combination with activation modelling. The C-14 measurement data for the Wylfa reactors shows considerable scatter, arising from uncertainties in radiochemical analysis, the influence of sample size, heterogeneity of the graphite and distribution of impurities.
Thank you for your attention. Any questions?