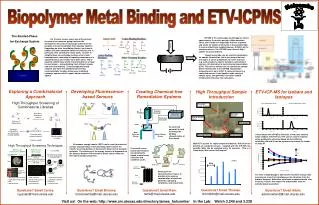
Biopolymer Spectroscopy
Biopolymer Spectroscopy. Introduction to Spectroscopy I Vibrational & Rotational Spectroscopy. Figure 19.1. Table 19.1. Infrared region of the electromagnetic spectrum. Gunzler and Gremlich, IR Spectroscopy , p. 1. Infrared Regions.


Biopolymer Spectroscopy
E N D
Presentation Transcript
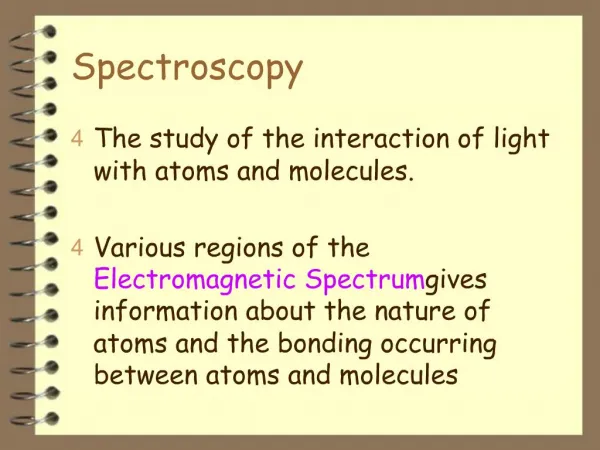
Biopolymer Spectroscopy Introduction to Spectroscopy I Vibrational & Rotational Spectroscopy
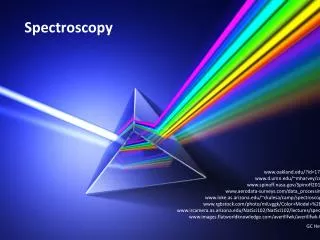
Infrared region of the electromagnetic spectrum Gunzler and Gremlich, IR Spectroscopy, p. 1
Infrared Regions The infrared region may be divided into three sections; near-, mid- and far-infrared: Region Wavelength range Wavenumber range (mm) (cm-1) Near 0.78 - 2.5 12800 - 4000 Middle 2.5 - 50 4000 - 200 Far 50 -1000 200 - 10 The most useful IR region lies between 4000 – 670 cm-1.
Figure 19.4 Spontaneous emission is a completely random process, the emitted photons are incoherent
In simple diatomic molecules, such as BrCl or CO, there is a certain distance between the atoms at which the attractive bonding forces and repulsive interactions between electrons balance each other. This distance is referred to as the equilibrium bond distance, req, and it can be changed by applying energy n is the frequency of vibration k is the force constant of the bond (the resistance of the bond to vibration and a measure of its strength)
Vibrational frequencies Reduced mass (m) = (m1 x m2)/(m1 + m2) The frequency of the vibrational transition is dependent on the nature of the atoms (reduced mass) and the strength (force constant) of the bonds between them. http://www.cem.msu.edu/~reusch/VirtualText/Spectrpy/InfraRed/infrared.htm#ir3
Morse potential, V(x) (red curve), as a function of the bond length, x, for HCl The zero of energy is chosen to be the bottom of the potential. The yellow curve shows a harmonic potential, which is a good approximation to the Morse potential near the bottom of the well. The horizontal lines indicate allowed energy levels in the Morse potential. De and Do represent the bond energies defined with respect to the bottom of the potential and the lowest state, respectively,and xe is the equilibrium bond length.
Harmonic/Anharmonic energy levels The total vibrational energy of a molecule is quantized, such that the vibrational quantum number, n, can take on values V= 0, +1, +2, +3, +4, ... Vibrational selection rule D V = +1 (0 1) For a harmonic oscillator, the energy (Joules) of a particular energy level is given by: Evib = h(V + ½)nvib= For an anharmonic oscillator, the expression is: Evib = h[(V + ½)nvib + (V + ½)Xcnvib] where Xc is an anharmonicity constant
Harmonic/Anharmonic energy levels Selection rule Hendra, Jones & Warnes, Fourier Transform Raman Spectroscopy, p. 21
Energy difference between any pairs of adjacent levels The frequency of radiation n that can bring about this change is :
Rotational Selection Rules Rotational Selection Rules: Dipole Moment Change is parallel to principal rotational axis of symmetry DJ = ± 1 (no Q fine structure) Dipole Moment Change is perpendicular to principal rotational axis of symmetry DJ = ± 1 (Q fine structure) Brisdon, p. 23
Vibrational energy levels – rotational energy levels DJ = +1 (R) DJ = -1 (P) http://www.chemistry.nmsu.edu/studntres/chem435/Lab9/intro.html
P, Q, and R Branches (NO gas) http://faculty.augie.edu/~kjbetsch/exp5.html
IR Spectrum Baseline 1 Background absorption 2 Absorption maximum 3 Shoulder; two non-separable bands Disturbances by absorption of CO2 and H2O in the air 4 5 Gunzler and Gremlich, IR Spectroscopy, p. 1
Vibrational excitations • The main types of bond excitation are stretching (nXY) and bending (dYXY) and often the absorption of certain wavelengths of infrared radiation may be correlated with the stretching or bending of certain types of bonds within a molecule. • Infrared spectra of compounds are complicated by bond oscillations in the whole molecule, giving rise to overtone and harmonic absorptions.
Stretching and Bending Vibrations http://www.shu.ac.uk/schools/sci/chem/tutorials/molspec/irspec1.htm
Infrared Active and Inactive Modes For a vibration mode to be infrared (IR) active, it must be accompanied by a change in the molecular electric dipole moment eg. linear CO2 No change in dipole moment Change in dipole moment Housecroft and Sharpe, p. 84
Infrared active stretches and bend Symmetric stretch Asymmetric stretch Bend http://sis.bris.ac.uk/~sd9319/spec/IR.htm
Active, inactive, and weakly active -C≡C- stretches CH3-C≡C-H infrared active, significant dipole moment CH3-C≡C-CH3 infrared inactive, no dipole moment CH3-C≡C-CH2CH3 weakly infrared active, small dipole moment
Vibrational Degrees of Freedom A molecule containing n atoms has 3n degrees of freedom, which describe the translational, rotational, and vibrationalmotions of the molecule: translational: 3 degrees of freedom (x, y, and z Cartesian axes) rotational: a non-linear molecule has 3 degrees of rotational freedom, while a linear molecule has 2 degrees of freedom vibrational: a non-linear molecule has 3n - 6 degrees of vibrational freedom, while a linear molecule has 3n - 5 degrees of freedom
Vibrational modes for linear CO2 Linear CO2 – number of modes = 3(3) – 5 = 4 Housecroft and Sharpe, p. 84
Infrared Spectrum of CO2 gas dOCO nCO http://chemistry.beloit.edu/Warming/moviepages/greenIR.htm
Vibrational modes for bent SO2 Bent SO2 - number of modes = 3(3) – 6 = 3 Housecroft and Sharpe, p. 84
Infrared Spectrum of H2O vapour http://chemistry.beloit.edu/Warming/moviepages/greenIR.htm
IR absorbance for common functional groups http://www.askthenerd.com/ocol/SPEC/IR/F1.HTM
The infrared spectrum of benzyl alcohol displays a broad, hydrogen-bonded -OH stretching band in the region 3400 cm-1, a sharp unsaturated (sp2) CH stretch at about 3010 cm-1 and a saturated (sp3) CH stretch at about 2900 cm-1; these bands are typical for alcohols and for aromatic compounds containing some saturated carbon. Acetylene (ethyne) displays a typical terminal alkyne C-H stretch, as shown in the second panel.
Saturated and unsaturated CH bands also are shown clearly in the spectrum of vinyl acetate (ethenyl ethanoate). This compound also shows a typical ester carbonyl at 1700 cm-1 and a nice example of a carbon-carbon double bond stretch at about 1500 cm-1. Both of these bands are shifted to slightly lower wave numbers than are typically observed (by about 50 cm-1) by conjugation involving the vinyl ester group. http://www.askthenerd.com/ocol/SPEC/IR/F1.HTM
Amide vibrations • The peptide group, the structural repeat unit of proteins, gives up to 9 characteristic bands named amide A, B, I, II ... VII. • The amide A band (about 3500 cm-1) and amide B (about 3100 cm-1) originate from a Fermi resonance between the first overtone of amide II and and the N-H stretching vibration. • Amide I and amide II bands are two major bands of the protein infrared spectrum. • The amide I band (between 1600 and 1700 cm-1) is mainly associated with the C=O stretching vibration(70-85%)and is directly related to the backbone conformation. • Amide II results from the N-H bending vibration (40-60%) and from the C-N stretching vibration (18-40%). This band is conformational sensitive. • Amide III and IV are very complex bands resulting from a mixture of several coordinated is placements. The out-of-plane motions are found in amide V, VI and VIII.
Amide A iswith more than 95% due to the the N-H stretching vibration. This mode of vibration is not depend on the backbone conformationbut is very sensitive to the strength of a hydrogen bond (between 3225 and 3280 cm-1 for hydrogen bondlength from 2.69 to 2.85angstrom,(Krimm & Bandekar Adv Protein Chem 1986;38:181-364).
Amide I is themost intense absorption band in proteins. It is primilary goverend by the stretching vibration of the C=O (70-85%) and C-Ngroups (10-20%). Its frequency is found in the range between 1600 and 1700 cm-1. The exact band position is determined by the backbone conformation and thehydrogen bonding pattern.
Amide II is found in the 1510 and 1580 cm-1 region and it is more complex than amide I. Amide II derives mainly from in-plane N-Hbending (40-60% of the potential energy). The rest of the potential energy arises from the C-N (18-40%)and the C-C (about 10%) stretching vibrations.
frequency, absorbance at the maximum (Ao), full width at half height (FWHH), surface of Gaussian band st=stretching vibration bd=bending s=symetrical as=asymetrical