Download
1 / 76
770 likes | 1k Vues
Weather, Climate & General Circulation B. N. Goswami Indian Institute of Tropical Meteorology. Introduction to Observed General Circulation of the Atmosphere or the Climate (the mean condition) Example of Weather producing systems (fluctuating component). Weather and Climate

E N D
Weather, Climate & General Circulation B. N. Goswami Indian Institute of Tropical Meteorology
Introduction to Observed General Circulation of the Atmosphere or the Climate (the mean condition) Example of Weather producing systems (fluctuating component)
Weather and Climate Weather is what yousee Climate is what youexpect In other words Weather is the Instantaneous State of the the Ocean-atmosphere system or the day-to-day fluctuations Climate is the ‘Mean’ state of the Ocean-Atmosphere System on which the day-to-day fluctuations or the Weather rides. Normally ‘mean’ refers to time mean (e.g. seasonal mean) Examples:
An example of weather and climate Daily time series of precipitation (PPT), eastward component of wind at 850 hPa level (U850) and temperature near the surface at 925 hPa at a tropical station around Bombay. The red line is the annual cycle or expected values.
Another example of weather and climate Daily time series of precipitation (PPT), eastward component of wind at 850 hPa level (U850) and temperature near the surface at 925 hPa at a high latitude station (70E,55N). The red line is the annual cycle or expected values.
Fig.5: Polar stereographic projection of geopotential height at 500 hPa in the NH on a typical day. The large scale waves with wavelength 3000-4000 km are seen.
Fig.6 : Polar stereographic projection of geopotential height at 500 hPa in the SH on a typical day. The large scale waves with wavelength 3000-4000 km are seen.
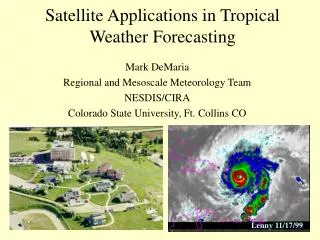
One heavy rainfall producer in the tropical region is the Tropical Cyclone. We observe, using a Geosynchronous satellite similar to NOAA’s GOES series, a Cyclone originating in the Indian Ocean in May of 1999. These storms can end droughts or cause devastating floods on the Indian Subcontinent. Hurricanes are hazardous for residents along the East Coast and Gulf of Mexico. Hurricane Floyd was a devastating flood-producer along the eastern U.S. coast in 1999. This view of Floyd is from one of NOAAs GOES satellites, which was developed and launched by NASA.
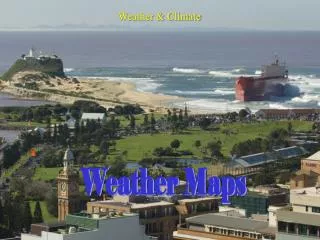
Another ex. of Weather in the tropics: A Low Pressure System on the ITCZ gives copious rain in Rajasthan-Gujarat, 5-8-04 IR picture from METEOSAT at 18UTC 05-08-2004
Meteosat cloud picture of June 09, 2008. Weather Vortices on the ITCZ
Observed mean structure of the Atmosphere • Observed vertical and horizontal structure of the atmosphere. • Temperature, winds and humidity fields. • What maintains this distribution? • Solar radiation and earth’s radiation and radiation balance. • Simple estimate of global mean surface temperature. • Greenhouse effect and examples of surface temperature of some other planets and their radiative equilibrium.
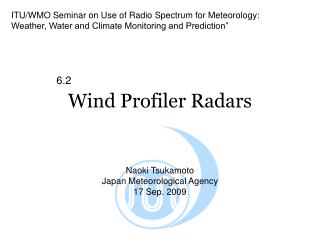
How do we characterize the atmosphere? Winds Temperature Humidity Rainfall Pressure How do we observe the atmosphere? • Traditional observing network Winds, Temperature & Humidity • Space based platforms • Weather Radars, wind profilers
From a network of roughly 900 upper-air stations, radiosondes, attached to free-rising balloons, make measurements of pressure, wind velocity, temperature and humidity from just above ground to heights of up to 30km. Over two thirds of the stations make observations at 0000UTC and 1200UTC. Between 100 and 200 stations make observations once per day, while about 100 have "temporarily" suspended operations. In ocean areas, radiosonde observations are taken by 15 ships, which mainly ply the North Atlantic, fitted with automated shipboard upper-air sounding facilities.
Why ‘Mean’ ? What ‘Mean’ ? • The atmosphere variables fluctuates in a wide range of time scales • In this lecture, we do not address the variation but concentrate on ‘time mean’ state of the atmosphere • However, there are clear differences between summer and winter. Therefore time mean will refer to seasonal mean. We shall show summer and winter separately The atmosphere has a 3-dimensional structure • There are east-west variations, north-south variations and variations in the vertical
Another example of weather and climate Daily time series of precipitation (PPT), eastward component of wind at 850 hPa level (U850) and temperature near the surface at 925 hPa at a high latitude station (70E,55N). The red line is the annual cycle or expected values.
Long term mean seasonal average vector winds during NH winter (DJF) and summer (JJA) at the surface. This is based on 40 years of NCEP/NCAR reanalysis. Colors indicate wind magnitude. Easterlies in the tropics and westerlies in the middle latitudes may be noted. Reversal of winds between the two seasons over the monsoon regions is seen.
Long term mean seasonal average vector winds during NH winter (DJF) and summer (JJA) at 850 hPa. This is based on 40 years of NCEP/NCAR reanalysis. Colors indicate wind magnitude. Easterlies in the tropics and westerlies in the middle latitudes may be noted. Reversal of winds between the two seasons over the monsoon regions is seen.
Long term mean seasonal average vector winds during NH winter (DJF) and summer (JJA) at 500 hPa. This is based on 40 years of NCEP/NCAR reanalysis. Colors indicate wind magnitude. Easterlies in the tropics and westerlies in the middle latitudes may be noted. Winds at this level over the monsoon regions are weak during both seasons.
Long term mean seasonal average vector winds during NH winter (DJF) and summer (JJA) at 200 hPa. Colors indicate wind magnitude. Easterlies in the tropics and jet-like strong westerlies are seen in the sub-tropics. Westerly jet in the winter hemisphere is stronger than that in the summer hemisphere.
Long term mean seasonal average vector winds during NH winter (DJF) and summer (JJA) at 100 hPa. Colors indicate wind magnitude. Easterlies in the tropics and jet-like strong westerlies are seen in the sub-tropics. An easterly jet over the equatorial monsoon region during summer. Also a massive anticyclonic circulation sits over the Tibet during summer.
Long term mean seasonal average vector winds during NH winter (DJF) and summer (JJA) at 50 hPa (lower stratosphere). Colors indicate wind magnitude. The striking feature is that westerly jetis asymmetric about the equator at this level. Summer hemisphere does not have westerly jet and the jet is located closer to the winter hemispheric polar region.
Eastward component of the winds (zonal winds, u) averaged along a latitude circle (zonal average) as a function of latitude and height (represented in pressure from 1000 hPa to 10 hPa. In the troposphere (below 100 hPa), subtropical westerly jets in both hemispheres may be seen. Westerly jet in the summer hemisphere and easterly jet in the winter hemisphere are seen the stratosphere.
Long term mean seasonal average temperature (K) during NH winter (DJF) and summer (JJA) at the surface. This is based on 40 years of NCEP/NCAR reanalysis. In the tropics (between 30S and 30N), latitudinal variations of temp. is very weak. It is rapid in the middle latitude. The equator-to-pole temp. difference is around 60K (40K)in winter (summer) hemisphere.
Long term mean seasonal average temperature (K) during NH winter (DJF) and summer (JJA) at 850 hPa. Similar to that at surface but the magnitude has decreased. The wave like structure of Temp. contours in NH winter (DJF) is due to land-ocean contrasts.
Long term mean seasonal average temperature (K) during NH winter (DJF) and summer (JJA) at 500 hPa. Similar to that at 850 hPa but the magnitude has further decreased. The wave like structure of Temp. contours in NH winter (DJF) is due to land-ocean contrasts.
Long term mean seasonal average temperature (K) during NH winter (DJF) and summer (JJA) at 200 hPa. Similar to that at 500 hPa but the magnitude has further decreased.
Long term mean seasonal average temperature (K) during NH winter (DJF) and summer (JJA) at 100 hPa. It may be noted that at this level, the equator is colder than the polar region reversing the equator to pole temperature gradient at this level compared to that at the surface.
Temperature (K) averaged along a latitude circle (zonal average) as a function of latitude and height (represented in pressure from 1000 hPa to 10 hPa. The temperature decreases to a height (tropopause) and increases thereafter. Height of the tropopause in the tropics is about 100 hPa while it is 300 hPa in polar regions. The symmetry of the temperature profile around the equator in the troposphere and its asymmetry in the stratosphere may be noted.
Specific humidity (g/kg) averaged along a latitude circle (zonal average) as a function of latitude and height (represented in pressure from 1000 hPa to 300 hPa. Pressure vertical velocity (hPa/s) averaged along a latitude circle (zonal average) as a function of latitude and height (represented in pressure from 1000 hPa to 100 hPa. Negative values represent upward motion.
Precipitation (mm day-1) Climatological mean precipitation (mm day-1) for January and July.
Some important features of the observed Mean condition of the atmosphere • Surface easterlies in the tropics & surface westerlies in the middle latitudes • Westerly jet stream in the upper atmosphere subtropics. Winter hemisphere jet tends to be stronger than the summer hemisphere one. • Easterly jet in the upper atmosphere over the equatorial region during summer monsoon region • Three cell meridional structure
Some important features of the observed Mean condition of the atmosphere (contd.) • Equator to pole temperature difference is about 600K in the winter hemisphere and about 350K in the summer hemisphere • The temperature gradient in the meridional direction is weak in the tropics and strong in the middle latitude. • Height of the tropopause is much lower in the polar region as compared to the equatorial region What drives this temperature and wind distribution in the Atmosphere?
(Top) Normalized blackbody radiation for sun (left) and earth (right). (Bottom) Absorption of solar radiation at 11 km and ground level.
Calculation of Radiative Equilibrium Temperature Te – Radiative equilibrium temperature τ – Infrared transmissivity (assuming no atmosphere, τ = 1.0) Solar constant S0 1365 W m-2 Albedo α = 0.3
Characteristics of atmospheres of four planets R – Radius in units of earth’s radius A – Albedo Te – Radiative equilibrium temp. Tm – Approx. measured temp. at the top of the atmosphere. Mr – Molecular weight of the air.
Role of the Atmosphere • Decreases Long Wave (LW) radiation loss to space • Depends on clouds, Water vapor, and CO2 distributions