Download
1 / 24
240 likes | 676 Vues
EVOLUTION OF GLOBINS. Evolution of Globins Evolution of visual pigments and related molecules. Evolution of gene clusters. Many genes occur as multigene families (e.g., actin, tubulin, globins, Hox) Inference is that they evolved from a common ancestor Families can be

E N D
EVOLUTION OF GLOBINS Evolution of Globins Evolution of visual pigments and related molecules
Evolution of gene clusters • Many genes occur as multigene families (e.g., actin, tubulin, globins, Hox) • Inference is that they evolved from a common ancestor • Families can be • clustered - nearby on chromosomes (α-globins, HoxA) • Dispersed – on various chromosomes (actin, tubulin) • Both – related clusters on different chromosomes (α,β-globins, HoxA,B,C,D) • Members of clusters may show stage ortissue-specific expression • Implies means for coregulation as wellas individual regulation
Evolution of gene clusters • multigene families (contd) • Gene number tends to increase withevolutionary complexity • Globin genes increase in number from primitive fish to humans • Clusters evolve by duplication and divergence
History of gene families can be traced by comparing sequences • Molecular clock model holds that rate of change within a group is relatively constant • Not totally accurate – check rat genome sequence paper • Distance between related sequences combined with clock leads to inference about when duplication took place
Classic phylogenetic studies of sequence conservation: the globins The globinsare the best studied family in terms of sequence conservation, partly because they were one of the first families for which multiple members were sequenced, and partly because some of the earliest protein structures (in fact, the earliest) solved were globins. The classic papers of Perutz, Kendrew and Watson were the first to correlate sequence conservation with aspects of protein structure and function. They drew their conclusion based on only a few aligned sequences. Later globin studies, such as that of Bashford, Chothia and Lesk, expanded the analyses of globin sequence conservation to include hundreds of sequences. Perutz, Kendrew & Watson J Mol Biol13, 669 (1965) Bashford, Chothia & Lesk J Mol Biol196, 199 (1987) Scapharca inaequivalvis oxygenated hemoglobin
Conservation of functional residues There were only 2 perfectly conserved residues among the 8 known globin structures at the time of the Bashford et al study. These are residues critical in binding of heme and/or interaction w/heme-bound oxygen. It will often be found that the best conserved residues in related proteins are those involved in critical aspects of the general function. Phe 43 heme His 87 Residues involved in more specific aspects of function may or may not be conserved, depending upon the relationship between the proteins under consideration. For example, residues involved in substrate specificity for serine proteases may be conserved among orthologs, such as the chymotrypsins, but not between paralogs, such as chymotrypsins and trypsins.
Conservation at buried positions • core residues, which are usually hydrophobic, often tolerate conservative substitutions, i.e. to other hydrophobics • overall core volume is well-conserved (Lim & Ptitsyn, 1970) though individual core positions tolerate variation in volume • this reflects what we know about packing and the effects of core mutations on stability--thus sequence conservation is partly related to maintaining a stable structure portion of alignment of prokaryotic and eukaryotic globins Y140 yellow = small neutral/polar green = hydrophobic red/pink = polar/acidic blue = basic buried human hemoglobin beta chain H156
Conservation at solvent-exposed positions • solvent-exposed (surface) positions are mutable and usually tolerate • mutation to many residue types including hydrophobics. Bashford et al., • however, noted that for globins at least, some surface positions do not • tolerate large hydrophobics. Since polar-to-hydrophobic mutations on protein • surfaces do not reduce stability, this conservation could reflect constraints • on solubility. Indeed, it is clear that the overall polar character of the • surface is conserved for soluble, globular proteins, even though a certain • number of hydrophobics may be tolerated. Y140 examples of surface residues yellow = small neutral/polar green = hydrophobic red/pink = polar/acidic blue = basic human hemoglobin beta chain H156
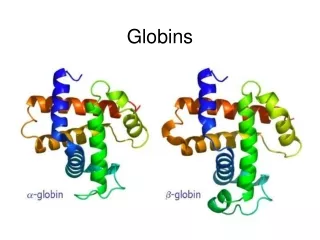
Conservation of loops and turns • “Spacer” regions between secondary structures, such as loops and turns, are often hypermutable and vary not only in sequence but in length, tolerating insertion and deletion events (Insertions and deletions are much less often found within secondary structure elements. Why?) part of alignment of animal hemoglobin a and b chains human a chain Are the a and b chains related to each other by paralogy or orthology?
Sequence identity and homology: poor coverage the two proteins have the same fold,both bind heme and oxygen in same place: good independent structural/functional evidence for homology... Yet alignments of their sequences reveal only 24% identity. There are also many examples of related globins and other proteins with much lower identity than this. 1MBO and 1HBB hemoglobin and myoglobin Any reasonable sequence identity criterion, whether it is a flat percent cutoff or a length-dependent cutoff, will give incomplete coverage--in other words, it will fail to identify many distant but true relationships.
Consensus Seq1 Seq2 Seq3 Seq4 Seq5 Seq6 Seq7 Seq8 Seq9 Seq10 Seq11 Number of individuals Number of mutations Evolutionary analysis: one step into the a priori prediction Synonymous Consensus: AAT GGC TCT TTT GAA AAA ... N G F F N K . Seq2: AAC GGA TGT TTC GAG AAA... N G C F E K . Non-synonymous Positive selection Neutrally fixed Purifying selection E AAT GGC TGT TTT GAA AAA ... N G C F N K .
Neutral evolution vs selection Non-synonymous nucleotide substitution changes Protein function or structure Amino acid replacements Neutral Theory of molecular evolution Biological fitness (W) Purifying selection Amino acid changes Neutrality Positive selection
Neutrality = 1 < 1 Purifying selection > 1 Positive selection Measuring the strength of selection
Two ways of testing the functional importance of peptide regions Experimental (Functional Biologists) Predictive (Evolutionary Biologists) Serial deletions and random directed mutagenesis Evolutionary and structural analysis Consensus: AAT GGC TCT TTT GAA AAA ... N G F F N K . Seq2: AAC GGA TGT TTC GAG AAA... N G C F E K .
Methods to detect adaptive evolution using DNA divergence data A B Maximum-likelihood models Kimura-based models Multiple alignment Sq1: ...ATGGGCGTC... Sq2: ...ATGGACGTA... Sq3: ...ATGGGAGAG... Sq4: ...ATGAGCGTC... A1 B1 Models to detect adaptive evolution at single codon sites Parsimony method to detect Selection at single sites Tree A2 B2 Sq1 a Sq2 b Models to detect adaptive evolution at specific lineages of the tree Sliding-window based Methods Sq4 Sq3 B3 A3 A4 Tree Sq1: ...ATGGGCGTC... Sq2: ...ATGGACGTA... Sq3: ...ATGGGAGAG... Sq4: ...ATGAGCGTC... Tree ...ATGGGCGTC... ...ATGGACGTA... ...ATGGGAGAG... ...ATGAGCGTC... 1 1 5 5 Sq1 Sq1 a a 2 2 Sq2 Sq2 b b 4 Sq4 Sq4 6 6 Sq3 Sq3
Intra-molecular co-evolution Tully and Fares (2006) Evol. Bioinf. Inter-protein/gene co-evolution Co-evolution/interaction between two different biological systems Different levels of protein’s function and evolution
Covariation analysis Substitution patterns at different positions in a sequence alignment are not necessarily independent. This is sometimes referred to as covariation or correlated evolution. namesequence A YADLGRIKS B YSDLGSEKE C IDDFGEIAA D IDDFGVIGT For example, in the mini multiple alignment shown at left, the identity of the residue at the 4th position is correlated to the identity of the residue at the 1st position. A statistical perturbation analysis can be used to characterize this covariation. An alignment of related sequences is “perturbed” by only considering sequences at which, for example, the first position is Y. The effect of this perturbation on the residue distribution observed at other positions is then measured. If the distribution changes significantly, covariation between sequence changes at the first site and other sites in the alignment is inferred.
Covariation and hydrophobic core packing The hydrophobic core residues in related proteins tend to be covariant due to constraints on core packing. One sees compensatory volume changes at different positions. Davidson and coworkers found that for 266 aligned SH3 domain sequences, the strongest covariation was observed for a cluster of central hydrophobic residues. For example, substitution of a smaller residue (Ala->Gly) at 39 was strongly correlated to substitution of a larger residue (Ile->Phe) at 50. Hydrophobic core of SH3 domains, with most frequently covarying residues shown in yellow S.M. Larson, A.A. DiNardo and A.R. Davidson, J Mol Biol 303, 433 (2000)
Some recent studies (Suel et al) have suggested a connection between covarying clusters of residues and transduction of signals between distant sites in proteins. For example, G-protein coupled receptors bind a ligand on one side of a membrane, and then transduce that signal to the other side through conformational change. Suel et al showed that the main clusters of covarying residues tended to connect the ligand and G-protein binding sites. ligand covarying networks (brown) membrane G-protein binding sites Suel et al. Nat Struct Biol 2003
A novel method to detect co-evolution in protein-coding genes (Fares and Travers, Genetics 2006) AAMWCGPCPNDEE CAMCCGMCMNDEE CAMDCGACANDEE AAMMCGCCCNDEE AAMWCGPCPNDEE CAMCCGMCMNDEE CAMDCGACANDEE AAMMCGCCCNDEE AAMWCGPCPNDEE CAMCCGMCMNDEE CAMDCGACANDEE AAMMCGCCCNDEE AAMWCGPCPNDEE CAMCCGMCMNDEE CAMDCGACANDEE AAMMCGCCCNDEE AAMWCGPCPNDEE CAMCCGMCMNDEE CAMDCGACANDEE AAMMCGCCCNDEE AAMWCGPCPNDEE CAMCCGMCMNDEE CAMDCGACANDEE AAMMCGCCCNDEE [ ] [ ] æ ö 1 T 1 T 1 ( ) æ ö ( ) ( ) 1 å å ( ) ( ) ( ) ˆ 2 ˆ 2 q = q = q q = q ç ÷ B x = q - q = q - q q = D D ç ÷ B x ek ek A ek B ek ij S S T T è t ø ek ek ek ek A ek ek B ij ij ij è t ø = = 1 1 S S ij ij AAMWCGPCPNDEE CAMCCGMCMNDEE CAMDCGACANDEE AAMMCGCCCNDEE AAMWCGPCPNDEE CAMCCGMCMNDEE CAMDCGACANDEE AAMMCGCCCNDEE AAMWCGPCPNDEE CAMCCGMCMNDEE CAMDCGACANDEE AAMMCGCCCNDEE AAMWCGPCPNDEE CAMCCGMCMNDEE CAMDCGACANDEE AAMMCGCCCNDEE Testing the significance of the correlation coefficient 1000 1 ( ) å 2 2 [ ] [ ] T T 1 1 r > = P ( 0 . 95 ) R , ( ) ( ) å å = q - q = q - q D D i 1000 A ek A B ek B = S S 1 i T T = = S 1 S 1 r - r " r ³ » = i 0 . 95 Z ( ) s r
Clade 1 > 75% Sequence alignment Clade 2 > 75% 3D Tree Molecular co-evolution analyses: CAPS (Fares and McNally, Bioinformatics 2006) Flow of information in CAPS Re-sampling Real 1 = 0.1 2 = 0.15 3 = 0.35 . . . i = 0.40 i+1 = 0.55 . . N-1 = 0.98 N = 0.99 1 = 0.55 2 = 0.98 Collate results from ‘re-sampling’ and ‘real’ data and sort by Calculate probabilities of R-values applying the step-down permutational correction Identify groups of co-evolving pairs with P > 0.95
Comparative analysis of sensitivities SENSITIVITY TRUE POSITIVES DISTANCE MICK Dependency CAPS lnLCorr
Divergence CAPS 100 CAPS MICK 90 DEPENDENCY lnLCorr MICK 80 70 Dep. 60 Mean Sensitivity LnLCorr 50 40 30 20 10 0 0.1 0.2 0.5 1 100 90 80 70 n. sequence 60 Mean Sensitivity 50 CAPS 40 MICK 30 20 Dep. 10 LnLCorr 0 10 20 30 Number of Sequences Distance
Co-evolving amino acid sites Spheres of 4Å radius Highly conserved sites at overlapping areas Three-dimensional spheres to detect protein-protein interfaces Co-evolving Amino acids share properties of hydrophobicity and molecular weight Protein-protein interfaces could be predicted with greater accuracy