Exploring Hardy-Weinberg Equilibrium Using Excel Simulations for Genetic Evolution Studies
This lab activity focuses on simulating Hardy-Weinberg equilibrium using MS Excel to model allele frequency changes in diploid organisms. Students will create a spreadsheet to analyze hypothetical gene pool dynamics across generations, exploring their questions on gene allele evolution and inheritance patterns. By utilizing tools within Excel, such as probability functions and data visualization, students will develop a deeper understanding of genetics and population dynamics. Prerequisites include knowledge of null hypothesis, basic Excel functions, and data graphing.


Exploring Hardy-Weinberg Equilibrium Using Excel Simulations for Genetic Evolution Studies
E N D
Presentation Transcript
Materials • MS Excel • ESTEEM module at: http://bioquest.org/esteem/esteem_result.php -or- http://bioquest.org/esteem/esteem_details.php?product_id=193# (a downloadable Excel book – must register at BioQuest) • Allele1 at http://faculty.washington.edu/herronjc/SoftwareFolder/AlleleA1.html • A ‘save early, save often’ attitude
Lab Goals • Students will build a spreadsheet that models how a hypothetical gene pool changes from one generation to the next • Students will generate their own questions regarding the evolution of gene alleles in a population, and then • Explore possible answers to those questions using a more sophisticated model than the one they created in Step 1.
Student “Prerequisites” • Know what the ‘null hypothesis’ is. • Have some familiarity with Excel. • This includes entering numbers, labels, and formulas and functions such as the SUM function • Creating graphs • Using logical statements such as the IF and SUM statements • Evaluate given data sets.
Lab Question • How do inheritance patterns or allele frequencies change in a population? • Assume a diploid organism • Instead of “A-a” to represent alleles, it is easier in a spreadsheet to use “A-B” to represent a pair of alleles. • Assume the infinite: all intoone gene pool, all live tojuvenile stage, all live to adults,none leave or enter, and no mutations. Mutation Gametes Adults Random mating Migration Zygotes Juveniles Selection
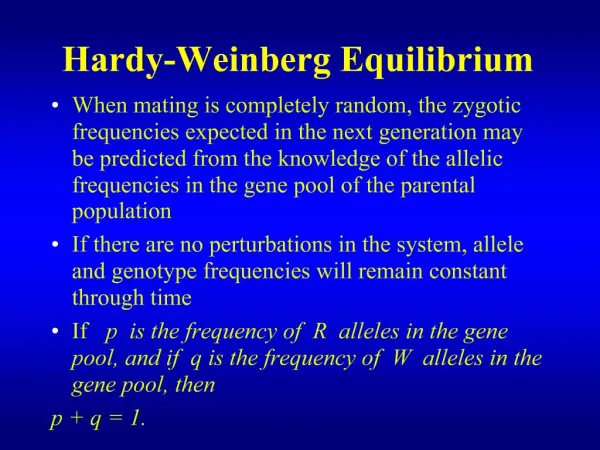
Lab Procedure • First, model how allele frequencies change through one lifecycle using a spreadsheet. • Have computer randomly draw gametes form the pool • Let p = frequency of allele A and • Let q = frequency of allele B
Lab Procedure • Start Excel. • Select cell D4. • Type p = frequency of allele A = and then press Enter. • In D5, type q = frequency of allele B = and then press Enter.
Lab Procedure • Now, place your pointer on the solid line between the column headings ‘D’ and ‘E’. • When the pointer changes shape, double-click. • The column resizes to a ‘best fit.’
Lab Procedure • Now, click in cell E4. • Type 0.6 and press Enter. Save your work!
Lab Procedure • In cell E5, type =1-E4 and press Enter. • The results of the calculation appear in E5.
Lab Procedure • Click and drag from D4 to E5. • On the ‘Home’ tab, click the ‘Fill Color’ paint bucket and shade these cells a color of your own choosing.
Lab Procedure • Select cell C2. • Type =rand() and then press Enter. • Press the F9 key a few times to see RAND in action. • Delete the RAND function from C2.
Lab Procedure • Select cell F7, type gametes, and then press Enter. • Now, select cells F7 and G7; apply an underline to them using the Home ribbon (look for a “U”) • On the ‘Home’ ribbon, click the ‘Merge & Center’ button.
Lab Procedure • Now, set up ‘The Randomizer’ to select one of your alleles. • Select cell F8 and enter the following but DO NOT press Enter yet: =if(rand()>=E4 • Press the F4 key once – E4 changes to $E$4. • Press the F4 key again – now $E$4 changes to E$4. Good. • Still in F8, type this: ,“A”,“B”) – and THEN press Enter. • Build the EXACT SAME formula in cell G8. Save your work!
Lab Procedure • Next, Press the F9 key to make ‘The Randomizer’ recalculate (or else you’ll just get the same results over and over, right?). • Press the F9 key 10-20 times and watch what happens. • Select cell E4 and try higher and lower p-values; for example what would you expect if you changed p to 0.8 (and you have 2 cells using that value)? • Predict what will happen before you press F9 on these trials.
Lab Procedure • You *could* just record with paper and pencil these ‘press F9’ recalculations. But what if you want a larger number, *and* you want Excel to graph the results? • Click and drag over cells F8 and G8. • Locate the solid black ‘fill handle’ in the lower right corner of the cell border – drag that down to row 23.
Lab Procedure • That gives you 16 offspring. Now let’s build some zygotes! • In cell H7, type zygotesand press Enter. • Now enter a cell function that ‘sews together’ whatever is in the two gamete cells next to it. In H8, type =concatenate(F8,G8) and then press Enter. • The results show a zygote with a genotype. Aw, cute! • Use the fill handle to fill this down to row 23 as well. Save your work!
Lab Procedure • Next you’ll track some results. Select cell i6, type genotype count and press Enter. • Click & drag from i6 to K6. Merge & center. • Select cell i7. Type AAand press Tab. • Type AB and press Tab. Type BBand press Enter. • Now select cell i8. Type =if(H8=“AA”,1,0) and press Tab twice.
Lab Procedure • In cell K8, type =if(H8=“BB”,1,0) and press Tab. • Now select the middle cell, J8. This cell can be either ‘AB’ or ‘BA’ – so we’ve got to outsmart it. • In J8, type =if(H8=“AB”,1,(if(H8=“BA”,1,0))) and press Enter. • That was called a “nested IF” statement. Now click and drag over cells I8, J8, and K8. • Fill those formulas down to row 23. • Check to make sure you entered these formulas correctly; no row should have a ‘1’ in more than one cell. Save your work!
Lab Procedure • Press the F9 key a number of times now. Check to make sure the functions and formulas you have entered are working properly. What is the expected outcome in the genotype area? If you aren’t sure, set the p-value to 0.5 and press F9 a few times. Now what’s the expected pattern? • Now let’s create some areas we can use to chart the results. Click cell H25. Type GenotypeTotals and press Tab. • In i25, type =sum(i8:i23) and press Enter. • Fill this function into both cells to the right.
Lab Procedure • Select cell H28, type gamete percent and press Tab. • In i27, type =i25 and press Enter. • In i28, type this: ‘-------- and press Enter. • In i29, type 16 and press Enter. • Click and drag from i7 to K7. Copy those cells. Click on i24 and paste the copied cells into place. • In j27, type = and then click on j25 and press Enter. • In k27, type = and then click on k25 and press Enter (this fills in the ‘BA’ and ‘BB’ columns) • Select cell i31. Type =i27/i29 and press Enter.
Lab Procedure • While still in cell i31, click the ‘Home’ tab and then click the ‘%’ button in the ‘Number’ category. Save your work!
Lab Procedure • Repeat for the other two genotype percentages. Drag i31 fill handle to k31. Save your work!
Lab Procedure • Next, you will create a chart of your results. • Click and drag from H24 to K25. • Press the ‘F11’ key to create a chart.
Lab Procedure • Click the chart legend and press Delete. • Click the genotype letters at the bottom of the chart. Right click and select font. Increase their font size to 14 points and bold. • Now do the same for the numbers along the vertical axis.
Lab Procedure • Click once inside the boundaries of the chart; the Chart Tools appear along the top. • Click ‘Change Chart Type.’ • Select the 3-D bar chart, and then click OK.
Lab Procedure • Click once outside the boundaries of the chart, and then once just inside the edge; press CTRL + C (to copy the chart). • Along the bottom edge of Excel, click the ‘Sheet 1’ tab. • Click cell M9 and press CTRL + V (to paste the chart). • Resize the chart using the handles along the edges. Save your work!
Lab Procedure • Save your work in Excel. • Click chart 1 tab • Print chart • Test your created model by clicking in E4 and changing the frequency of p • Note what happens to your chart and your tables • Again, click chart 1 tab and print.