Download
1 / 29
290 likes | 318 Vues
This lecture discusses the concept of population in microevolution and explores the Hardy-Weinberg Equilibrium. It explains allele frequencies, genotype frequencies, and the assumptions for the equilibrium. The lecture also touches upon polygenic inheritance and genetic drift.

E N D
What is a Population? • A population is a group of individuals living in a particular area. Individuals in a population usually mate with other individuals from that population.
Fig. 23.3. One species, two populations. The two populations can interbreed perfectly, but most matings are within a herd (population).
Frequencies of the sickle-cell allele 0–2.5% 2.5–5.0% 5.0–7.5% 7.5–10.0% Distribution of malaria caused by Plasmodium falciparum (a protozoan) 10.0–12.5% >12.5% Figure 23.13 Mapping malaria and the sickle-cell allele (ignore malaria for now). Note how the frequency (percentage of the allele in the population) changes from place to place.
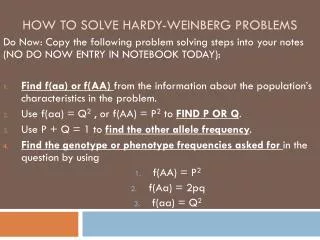
What is the allele frequency of this population? • Allele frequency is the fraction: • For 2000 people, there are 4000 alleles in the gene pool • 720 bb • 960 Bb • 320 BB no. of a particular allele no. of all alleles in population • how many B alleles? • how many b alleles?
For 2000 people, there are 4000 alleles in the gene pool • Allele frequency for the recessive b allele = 0.6 • Allele frequency for the dominant B allele = 0.4
What happens in the next generation? • In all the matings for this generation, What is the chance that a B egg will be fertilized by a b sperm? • 40% of all eggs will carry B • 60% of all sperm will carry b • *Assuming no difference between sexes and no mating preferences! • 0.4 x 0.6 = 0.24 • 24% of offspring Bb
What happens in the next generation? 40% B 60% b 40% B 60% b BB Bb Bb bb 0.4 x 0.4 = 16% BB 0.4 x 0.6 x 2 = 48% Bb 0.6 x 0.6 = 36% bb
In all the matings for this generation: • 0.4 x 0.4 = 16% BB • 0.4 x 0.6 x 2 = 48% Bb • 0.6 x 0.6 = 36% bb If 4000 Offspring 640 BB = BROWN 1920 Bb = BROWN 2560 total 1440 bb = BLUE
New allele Frequencies • If 4000 Offspring • 640 BB = BROWN • 1920 Bb = BROWN • 1440 bb = BLUE 3200 brown alleles / 8000 =0.4 4800 blue alleles / 8000 = 0.6
After 5 Generations: • 64000 Offspring • 10,240 BB • 30,720 Bb • 23,040 bb • After 5 generations (or any number): • Allele frequencies do not change! • Recessive alleles are maintained in the population 51,200 brown alleles / 128,000 = 0.4 76,800 blue alleles / 128,000 = 0.6
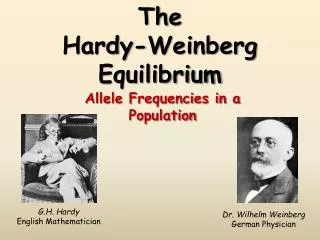
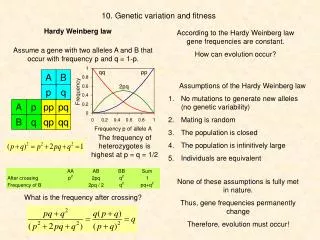
What is Hardy-Weinberg Equilibrium? • Godfrey Hardy and Wilhelm Weinberg (1908): • Given some assumptions, allele frequencies won’t change • Population is at equilibrium • This means the population is NOT evolving • Recessive alleles are maintained • Algebra can be used to calculate allele frequencies
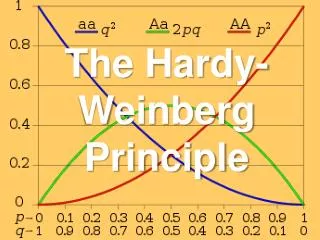
What is the Hardy Weinberg Equation? • Allele frequency: • Let p = frequency of the dominant allele • Let q = frequency of the recessive allele • Then, p + q = 1 • Genotype frequency: • p2 = frequency of homozygous dominant genotype • q2 = frequency of homozygous recessive genotype • 2pq = frequency of heterozygous genotype • p2 + 2pq + q2 = 1
What are the assumptions for Hardy-Weinberg? • Allele frequencies do not vary if: • The population is large • Mating is random • No migration in or out • No isolated groups within the population • No mutation • No selection (no allele is advantageous) • Does Hardy-Weinberg work? • In large populations, the Hardy-Weinberg equations predict results quite well for many traits • If a population is not in equilibrium: • Allele frequencies are changing • Evolution is occurring!
Polygenic inheritance: additive effects (essentially, incomplete dominance) of multiple genes on a single trait Although this hypothetical example shows a normal (or bell) curve resulting from an F2 cross, it is also representative of typical population data for polygenic traits (or characteristics), in which there is often an environmental component as well as polygenic inheritance.
Allele frequencies do not remain exactly the same from generation to generation, especially in very small populations. A process called genetic drift - random changes in allele frequencies - occurs in all populations.
CWCW CRCR CRCR CRCR CRCR CRCR CRCW CRCR CRCW Only 5 of 10 plants leave offspring Only 2 of 10 plants leave offspring CRCR CRCR CWCW CRCR CWCW CRCR CRCW CRCW CRCR CRCR CRCR CWCW CRCR CRCW CRCR CRCR CRCR CRCR CRCW CRCW CRCW Generation 2 p = 0.5 q = 0.5 Generation 3 p = 1.0 q = 0.0 Generation 1 p (frequency of CR) = 0.7 q (frequency of CW) = 0.3 Figure 23.7 Genetic drift Genetic drift chance allele frequency change
Genetic drift chance allele frequency change In any population, but especially small populations, allele frequencies change over time by chance. An allele frequency graph
Genetic drift chance allele frequency change 1 0.8 If you follow allele frequency change in several small populations, you get a different result each time. One possible outcome is allele “fixation” - loss of one allele. 0.6 0.4 0.2 0 0 1 2 3 4 5 6 7 8 9 generations An allele frequency graph
Genetic drift chance allele frequency change 1 0.9 0.8 N = 10 beetles in population 0.7 0.6 0.5 red freqency b+ allele 0.4 0.3 b+ b+ 0.2 0.1 0 A real experiment with the b locus in flour beetles. 0 2 4 6 8 10 12 14 16 18 20 generations (time) 1 brown 0.9 b+ b 0.8 0.7 0.6 0.5 frequency b+ allele 0.4 N = 50 beetles in population 0.3 0.2 black 0.1 0 b b 0 2 4 6 8 10 12 14 16 18 20 generations (time) Note effect of population size
Genetic drift can be shown in the lab, using populations of different sizes and initial 50:50 frequencies of two “neutral” alleles. 1.0 0.5 allele A neither lost nor fixed 0 1 5 10 15 20 25 30 35 40 45 50 Generation (500 flies at the start of each line or population)
In small populations one or other of the alleles is inevitably lost. 1.0 AA in five populations 0.5 allele A lost from four populations 0 1 5 10 15 20 25 30 35 40 45 50 Generation (25 flies at the start of each line or population)
(a) Shaking just a few marbles through the narrow neck of a bottle is analogous to a drastic reduction in the size of a population after some environmental disaster. By chance, blue marbles are over-represented in the new population and gold marbles are absent. Bottlenecking event Surviving population Original population (b) Similarly, bottlenecking a population of organisms tends to reduce genetic variation, as in these northern elephant seals in California that were once hunted nearly to extinction. Genetic drift chance allele frequency change Figure 23.8 A special case of genetic drift: The bottleneck effect
Cheetahs are another example of a species that appears to have experienced a severe bottleneck in the relatively recent past, because their genetic variability is extremely low. For example, skin grafts from one cheetah to another are no rejected.
Polydactyly in Pennsylvania Old Order Amish (founding population approximately 200 people, almost always marry within the group) Johns Hopkins University Press
Genetic drift chance allele frequency change Some facts about genetic drift: 1. It occurs the same way if there are more than 2 alleles, it just produces a more complicated-looking graph. 2. It is most powerful in small populations, but is inevitable even in large populations. 3. If it goes on long enough, it is possible for one allele to become the only allele in the population. This allele is now said to be “fixed”. The opposite of fixation is allele loss or allele extinction. New mutants run a huge risk of going extinct, but some do increase, and even become fixed, by chance. Over truly long periods drift and mutation are the primary causes of changes in nucleotides sequence in non-coding parts of genomes.
Mutations types rates effects All variation (all alleles) must originate at some point by mutation. A mutation is essentially an error in DNA replication. We will follow the book with a very simple classification of mutations, specifically in genes. Point mutation - change in a single base. These can either have no effect (silent mutation - remember that the genetic code is redundant), change an amino acid (missense mutation), or form a new stop codon leading to truncation of the encoded protein (nonsense mutation). Insertions and deletions - if these are a multiple of three they lead to gain or loss of amino acids. If they are not a multiple of three they cause frameshifts, leading to truncated strange proteins.
Mutations types rates effects Mutations are low probability events, one in a million events, but one must remember how many DNA replications there are in the development of an organism, and that population sizes can be in the billions. Thus, mutations are inescapable. The probability of a mutation is called its mutation rate.
Mutations types rates effects The effects of mutations range from one extreme to the next. Many are deleterious - they have a negative effect on the organism (often only in homozygous condition). A great many are what we will call “neutral” - they have no effect on the organism. Microsatellite alleles are an example. A small number are actually beneficial to the organism. Mutations for insecticide resistance are an example.