Download
1 / 17
170 likes | 395 Vues
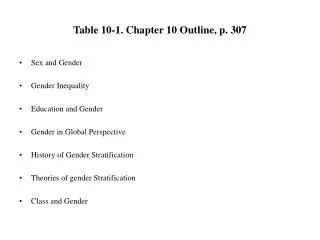
Table 10-1. Chapter 10 Outline, p. 307. Sex and Gender Gender Inequality Education and Gender Gender in Global Perspective History of Gender Stratification Theories of gender Stratification Class and Gender.

E N D
Table 10-1. Chapter 10 Outline, p. 307 • Sex and Gender • Gender Inequality • Education and Gender • Gender in Global Perspective • History of Gender Stratification • Theories of gender Stratification • Class and Gender
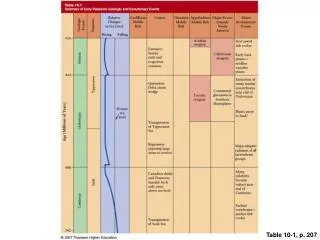
Table 10-2. Female to Male Percent Median Hourly Earnings by Race andEthnicity, 1989-2005 (based on Kerbo, p. 312)
Figure 10-1. Women’s and Men’s Median Annual Earnings for Full-time Year-round Workers, 1970-2007 (in 2007 $) source: http://www.census.gov/hhes/www/income/histinc/p36AR.html
Figure 10-2. Female to Male Earnings Ratio, 1970-2007 (based on figures from Figure 10-1)
Table 10-3. Percent of White and Black, Male and Female Workers in Full-time, Year-Round Employment from 1974- 2004 Source: U.S. Census Bureau, Historical Income Tables,
Figure 10-3. Median Annual Income for Men and Women by Occupation, 2004 (Kerbo, p. 315)
Figure 10-4. Median Annual Income for Fulltime, Year-Round Men and Women by Occupation, 2004 (Kerbo, p. 315)
Figure 10-5. Gender Gap by Occupation in Median Annual Income for All Workers and for Fulltime, Year-Round Workers, 2004 (Kerbo, p. 315)
Figure 10-6. Proportion of All and of Fulltime, Year-Round Women to Men by Occupation, 2004 (Kerbo, p. 315)
Table 10-4. United Nations Rankings of Gender Empowerment, 2006 (Kerbo, p. 318)
Table 10-4. United Nations Rankings of Gender Empowerment (Kerbo, p. 318) [continued]
Table 10-5. State-Mandated Maternity/Childcare Leave by Country (Kerbo, p. 319)
Table 10-5. State-Mandated Maternity/Childcare Leave by Country (Kerbo, p. 319) [continued]
Figure 10-7. Percent College Graduates for Females and Males by Age, 2003 (based on Kerbo, p. 322)
Figure 10-8. Percent College Graduates for Black and White Females and Males, 1960-2005 (based on Kerbo, p. 321)
Table 10-6.Wright’s Class Categories by Race and Sex (Kerbo, p. 338)
Table 10-7. Comparative Data on Males and Females in Management Positions (Kerbo, 340)