SlideServe
Menu
Préférences
© SlideServe · v2026

Table 11-1. Chapter 11 Outline (Kerbo, p. 343)

colorado-massey avatar
19 diapositives · 369 Views · Nov 18, 2014

Table 11-1. Chapter 11 Outline (Kerbo, p. 343). Defining Race and Ethnicity Racial and Ethnic Inequality A History of Race and Ethnicity Global Immigration: Comparative Views Theories of Racial and Ethnic Inequality.
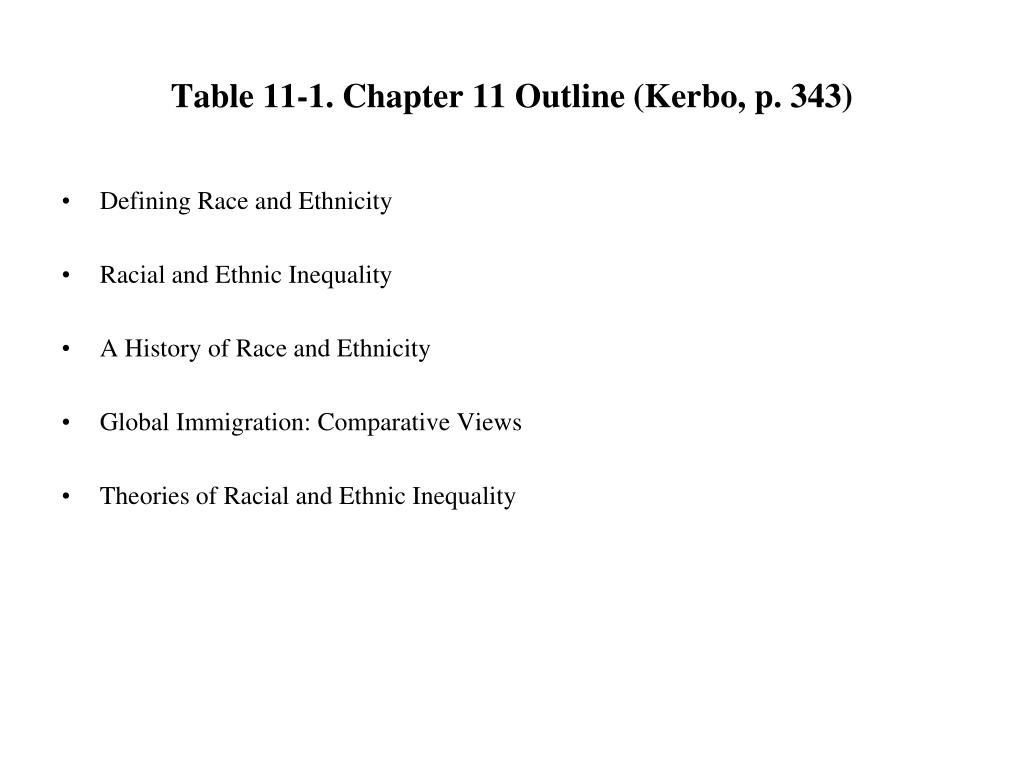
Table 11-1. Chapter 11 Outline (Kerbo, p. 343) - slide 1
01 / 19Table 11-1. Chapter 11 Outline (Kerbo, p. 343)
1 / 17

Télécharger la présentation

Table 11-1. Chapter 11 Outline (Kerbo, p. 343)
Une image / un lien ci-dessous est fourni (tel quel) pour télécharger la présentation

Politique de téléchargement : le contenu du site vous est fourni TEL QUEL pour votre information et votre usage personnel ; il ne peut être vendu, concédé sous licence ni partagé sur d’autres sites sans l’accord de son auteur.Le contenu vous est fourni TEL QUEL, pour votre information et votre usage personnel uniquement. Téléchargez la présentation en cliquant sur ce lien. Lors du téléchargement, si vous ne parvenez pas à télécharger une présentation, l’éditeur a peut-être supprimé le fichier de son serveur.Pendant le téléchargement, si vous ne parvenez pas à obtenir une présentation, le fichier a peut-être été supprimé par l’éditeur.

F I N

Plus de contenu associé

Transcription de la présentation
  1. Table 11-1. Chapter 11 Outline (Kerbo, p. 343) • Defining Race and Ethnicity • Racial and Ethnic Inequality • A History of Race and Ethnicity • Global Immigration: Comparative Views • Theories of Racial and Ethnic Inequality

  2. Table 11-2. Black/White and Latino/White Household Income (Percent), 1972-2005 (Kerbo, p. 347)

  3. Figure 11-1. Median Household Income by Race

  4. Figure 11-2. Median Household Income (in Thousands of 2007 U.S. Dollars) by Race of Householder Source: Table H-5. Race and Hispanic Origin of Householder --Households by Median and Mean Income: 1967 to 2000 (census.gov)

  5. Figure 11-3. Median Household Income (in Thousands of 2007 U.S. Dollars) by Race of Householder Source: Table H-5. Race and Hispanic Origin of Householder --Households by Median and Mean Income: 1967 to 2000 (census.gov)

  6. Figure 11-4. Racial and Gender Gaps (Compared to White Men) in Mean Income, 1974-2004 Source: Hogan and Perrucci 2006 (census.gov, 2005)

  7. Table 11-3. Unemployment Rates for Whites, Blacks, and Latinos, 1980-2006 (Kerbo, p. 349)

  8. Table 11-4. Occupational Distribution for Blacks and Latinos, 1983-2002 (Kerbo, p. 332)

  9. Figure 11-5. Median Household Income by Race

  10. Table 11-5. White, Black and Latino Percent High School Graduates, 1960-2005 (Kerbo, p. 355)

  11. Figure 11-6. White, Black, and Latino Percent College Graduates, 1960-2005 (Kerbo, p. 355)

  12. Figure 11-7. Percent White, Black, and Latino Persons Aged 25-29 By Educational Attainment in 2003 (Kerbo, p. 357)

  13. Figure 11-8. Income for White, Black, and Latino Persons By Educational Attainment in 2004 (Kerbo, p. 359)

  14. Figure 2-10. Median U.S. Household Net Worth by Race, 1991 and 2004 (from Kerbo, p. 34) and Percent of White Wealth for Black Households

  15. Figure 2-11. Median Income and Net Worth for White Families and Other Families in 2001(From The Wealth Inequality Reader, p. 14)

  16. Table 11-6. Percent of Population Foreign Born by Country, 1997 (Kerbo, Sixth Edition, p. 353; compiled from CIA report)

  17. Figure 11-9. Foreign Born in U.S. By Region of Origin

  18. Figure 11-10. Foreign Born Population in the U.S., 1960-2003 (in Millions) Source: U.S. Bureau of the Census, Table 3. Foreign –Born Population: 1960 to 1990; Current Population Survey, 2003, Annual Social and Economic Supplement

  19. Table 10-7.Wright’s Class Categories by Race and Sex (Kerbo, p. 338)