Download
1 / 45
450 likes | 535 Vues
Delve into the late Cenozoic marine and non-marine stratigraphic problems in Arctic regions, paleogeography of Alaska, and the Arctic coast’s sea level history. Discover the Arctic climate evolution and deglacial history of New England through advanced chronostratigraphic methods. Explore the significance of the Bering Strait and Chukchi Sea in understanding past climates and their impact on modern circulation. Unravel the mysteries of the Pliocene and Last Interglacial periods to gain insights for the future.

E N D
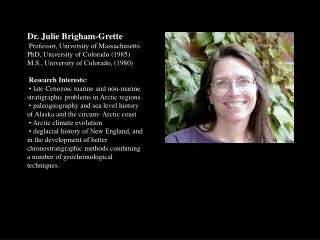
Dr. Julie Brigham-Grette Professor, University of Massachusetts. PhD, University of Colorado (1985) M.S., University of Colorado, (1980) Research Interests:•late Cenozoic marine and non-marine stratigraphic problems in Arctic regions • paleogeography and sea level history of Alaska and the circum- Arctic coast • Arctic climate evolution • deglacial history of New England, and in the development of better chronostratigraphic methods combining a number of geochronological techniques.
Déjà vu: a Paleoenvironmental Look at Sea Ice Extent during Earlier Warm Periods Julie Brigham-Grette and Zachary Lundeen With unpublished model input from Bette Otto-Bleisner (NCAR), Gifford Miller (Colorado) And Jon Overpeck (Arizona)
Where we are now – less than 2% of geologic time Hayes et al., 1998
Fact:There are no analogs for the future we face • Must learn more from the Paleorecord = Earthunder different forcings and mean states.
Refined age for the earliest opening of the Bering Strait at 5.32 Ma (Paleo3, 2002) A. Gladenkov Oleinik Marincovich Barinov
Ellesmere Island Meighen Island Hvitland Beds ~ 3.2 Ma Bob Corell • Marine sediments • Arctica islandica • 5 types of Pines • Overlain by • First evidence of Tundra No Arctic Sea Ice even in Winter No Greenland Ice Sheet
Pliocene Sea level record Skull Cliff, SW of Barrow Northern Alaska Gubik Formation Sea Level Transgressions Simpsonian 80 ka Pelukian 125 ka Wainwrightian 410 ka Fishcreekian 2. 4 Ma Bigbendian 2.6 Ma Colvillian ~ 3.0 Ma Wainwrightian Fishcreekian
Significant Northward Range extensions in marine biota -- significantly warmer waters in Beringia Shoreline Elevations MIS 5a 6-7 m MIS 5e 8-10 m MIS 11 22-23 m ~2.4 Ma ~33 m ~2.6 Ma >40 m ~3.0 Ma >40 m Maps Created by Bill Manley
North Slope Alaska Warm Pliocene Transgressions ~2.4 Ma ~2.6 Ma ~3.0 Ma Did the earliest glaciations occur when the Arctic Ocean was ice free? (as proposed by Hamilton for the Gunsight Mt. Glaciation)
~3.0 My Pliocene Vegetation Warmer/Wetter Pollen by Robert Nelson, Colby College ____________ Offshore warm too No seasonal Arctic sea ice during interglacials ~2.6 My ~2.4 My
Why Study the Last Interglacial Generally Speaking: • Last time global climates were significantly warmer than present • A possible analog for future warm climates Concentration of Last Interglacial sites • Europe and the North Atlantic • Alaska • Few sites in Siberian part of the Arctic
During 5e, Treeline migration of ~600 km north ward; in many areas tundra eliminated from the arctic coast in NE Siberia Lozhkin and Anderson, 1995 QR Winter sea ice max 5e During 5e, winter sea ice limit ~800 km north of present, Bering Sea ice free year around; Arctic Ocean nearly ice free some summersBrigham-Grette & Hopkins, 1995 QR Winter sea ice today Maps Created by Bill Manley
Solar Radiation Changes at 70NAt top of atmosphere • Holocene solar anomaly of 50 W/m2 exceeded from 133 to 125 ka. • At 130 ka, maximum anomaly occurs in May (+70 W/m2) and minimum anomaly occurs in September (-50 W/m2). Otto-Bliesner et al., in prep. Outgrowth of recent PAGES-CAPE meeting *
Dataversus CCSM Model Summer (JJA)surface air temperature anomalies Last Interglacial +4 to + 8 +2 ≥ +4 +5 +6 to + 8 +2 to +3 +6 CAPE Last Interglacial Working Group, in prep. +2 +2 to +4
CCSM Summer (August) Sea Ice Area (%) 130 ka Present 130 ka - Present Otto-Bliesner et al., in prep.
Elemental and Isotopic Constraints on the Late-Glacial/Holocene Paleoceanography of the Chukchi SeaZach LundeenUniversity of Massachusetts-Amherst
Why is Bering Strait area important? • Bering Strait through-flow provides ~1/3 of fresh water flux to Arctic Basin-affects heat budget • helps maintain a strong halocline that enhances sea ice formation and isolates warmer Atlantic derived water from exchanging heat with the atmosphere • Affects sea ice export to Atlantic, with possible implications for global thermohaline circulation • Chukchi Sea is a significant carbon sink today • surface water in summer is consistently undersaturated with CO2 due to biological drawdown and physical water mass changes that alter carbonate system equilibrium • Changes in land sea distribution following LGM are likely to have affected the local climate by altering maritime influences
14.5-16.5ka 10-12ka -108m -64m -50m Modified from Manly, W.F., 2002 Postglacial Flooding of the Bering Land Bridge: A Geospatial Animation: INSTAAR, University of Colorado, v1 8-9.5ka -22m -36m -0m
Global Sea Level Reconstruction 10-12ka Bering Strait sill depth breeched Sea Level curve based on Lambeck et al, 2002
Estimated Transgressive Ages at Core Sites JPC10 10-12ka JPC24 12.5-14ka JPC28 14.5-16.5ka Sea Level curve based on Lambeck et al, 2002
Carbon Isotopes in Organic Matter • Carbon isotopic compositions of organic matter are determined by : • Source of carbon - atmospheric CO2, dissolved inorganic carbon (DIC) • Fractionation during photosynthesis - dependant on pathway. C3 (-20‰) vs C4 (-7‰) • Availability of carbon source - high concentrations lead to more fractionation, low concentrations lead to less fractionation • Cell geometry (surface area) and growth rate- large, fast growing cells are generally less depleted in C-13 than small, slow growing cells • Diagenetic alteration- selective lossof isotopically heavy constituents (proteins, carbohydrates) can alter residual OM composition. Incorporation of isotopically depleted bacterial biomass can also affect bulk properties
Nitrogen isotopic composition determined by: • Source of nitrogen- atmospheric, dissolved inorganic nitrogen (NO3, NH4, etc.), particulate organic nitrogen • Trophic level- enrichment in N-15 occurs at each trophic level due to preferential excretion of N-15 depleted waste products • Availability of nitrogen source- degree of nutrient utilization affects the ability to preferentially use N-14. High degree of utilization will result in relatively enriched 15N values • Diagenetic Alteration- under highly productive waters denitrification can occur, preferentially releasing N-14. Selective degradation can also affect composition of residual OM Aah, a cool pint of Guinness! Nitrogen Isotopes
Values observed today in study area Dissolved NO3 Atm N2 Marine phytoplankton Land plants -10 -5 0 5 10 Typical 15N values C3 land plants C4 land plants DIC Atm. CO2 Marine phytoplankton 0 10 -30 -20 -10 Typical 13C values Average terrestrial OM from 12 Siberian rivers and MacKenzie River - 13C values = -26 to -27‰
Modern Sedimentary OM 13C Modified from Naidu et al., 2000
C/N Ratios • OC/N ratios of OM can be used do differentiate terrestrial sources from marine sources, or indicate degree of degradation • Typical marine OM has C/N value ~ 6-7 • Typical terrestrial OM has C/N values from 20-400 • Marine OM C/N values typically increase with diagenetic alteration as nitrogen rich compounds are preferentially utilized • Soil OM has lower C/N than parent materials due to adsorption of nitrogen compounds in soils • Particulate OM in 12 Siberian rivers (highly degraded) had average C/N of ~11, dissolved OM C/N ~40 • Susceptible to misinterpretation in sediments with low organic content due to inorganic nitrogen (not significant in organic rich seds) • Somewhat grain size dependant
Core Sites JPC28 JPC24 JPC10
Increased productivity leads to denitrification in sediments leading to higher ) 15N values • 8500 ka event shows low TOC, depleted (terrestrial) 15N values, low (marine) C/N values, 13C values relatively unchanged • 11ka- abrupt increase in TOC from ~0.65% to 0.9%, and >1‰ increase in 15N coincident with transgression of sill depth at Bering Strait • After ~8.5ka, sharp increase in TOC, %N, 15N values, and 13C values.
Core Sites JPC28 JPC24 JPC10
Assumed to be synchronous 6700 14C yrs BP = ~7000 cal yrs BP JPC28 JPC24
JPC 28 Age Model a.k.a. “The dreaded wiggle match” Note: The two data sets were analyzed in different labs, JPC24 was done at UMASS, JPC 28 was analyzed at UKentucky. All samples from both data sets were treated and packed into capsules at UMASS. Actual date
~8500ka abrupt increase in TOC, C/N, 15N, and 13C • N isotopic shift indicative of increased relative marine OM input, higher degree of nutrient utilization, and/or denitrification in sediments- consistent with sharp increase in OM delivery to sediments • Shift in C isotopes is indicative of higher productivity (biological drawdown of DIC), with possible additional influence of temperature effects on pCO2 of sea water • Steady increase of 13C values from 7ka to present is likely a diagenetic signal- more selective degradation due to increased supply • C/N shift at ~8500 is also likely to be an indicator of more selective degradation of OM due to increased supply.
Modern Sea Ice Maxima - March Modern Sea Ice Minima - October
Modern Surface Circulation Through Canadian Arctic The Dyke et al., story…
Speculation… • Alternative ways to cut off the nutrient source: • Remove the transport pathway- freshwater lens in Arctic reverses the sea level gradient and slows or halts the northward flow through the Bering Strait?-mollusk evidence against idea • Remove the nutrients from the transported water mass- upwelling absent off Gulf of Anadyr prior to 8-9Ka?- radiolarian assemblages may support idea
The Early Holocene Reorganization • Increased sea ice in the Canadian Arctic after 8500 yrs as evidenced by lack of bowhead whale remains • Increased salinity in the Canadian Arctic after 9000 due to decreased meltwater • Shift in path of Trans Polar Drift ~8500 yrs BP evidenced by drift wood distribution • Foraminiferal biozone change at • ~8500 yr BP associated with changes in Atlantic incursion into Arctic Basin
Conclusions • Arctic Sea ice became perennial about 2.4 Ma ago. Permafrost more widespread. • Sea Ice extent likely impacted Pliocene glacial ice extent • Warmer waters have repeatedly entered the Arctic Basin, esp. during warmer interglacials. • Winter Sea Ice limit was likely 800 km north of today about 125 ka • During the Last Interglacial, some summers may have been without sea ice (Atlantic layer water shallower) • Sea ice was less than present during most of the early Holocene across the Arctic. • Significant changes in Arctic Sea Ice distribution, water mass characteristics and circulation have been documented ~8500 ka suggesting a possible driving mechanism or a common response to a driving mechanism • Diatom studies or other sea ice indicators may help develop a more definite interpretation of the data