Global Warming's Impact on Food Security in Southeast Asia
520 likes | 622 Vues
Explore the commitment to significant global warming and its implications for food security, including extreme weather events, drought, and world food prices in Southeast Asia. Learn more about the vulnerability and risks associated with climate change in the region.

Global Warming's Impact on Food Security in Southeast Asia
E N D
Presentation Transcript
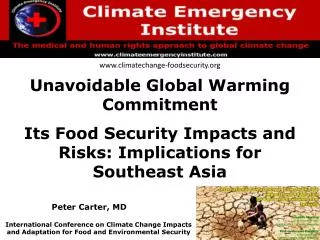
www.climatechange-foodsecurity.org Unavoidable Global Warming Commitment Its Food Security Impacts and Risks: Implications for Southeast Asia Peter Carter, MD International Conference on Climate Change Impacts and Adaptation for Food and Environmental Security
Global climate change and food security is the most important issue for the entire world today International Conference on Climate Change Impacts and Adaptation for Food and Environmental Security
ClimateEmergencyInstitute.com/asia.html ClimateChange-FoodSecurity.org Asia Development Bank 2009 Climate Change Facts & Figures ADB 2010
Presentation Committed global warming Climate-crop models Extreme weather events Drought World food prices Climate-crop model results 2009
Today is a committed global climate change food security emergency
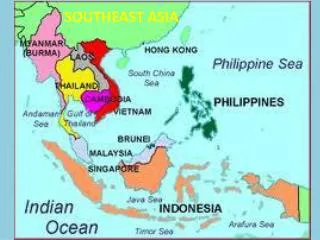
Vulnerability Maplecroft Climate Change Vulnerability Index in Asia Extreme risk High risk Low risk Myanmar Thailand Vietnam Cambodia Philippines Brunei Malaysia Singapore Indonesia
Vulnerability Maplecroft Climate Change Vulnerability Index in Asia Vulnerableto world food prices Extreme risk High risk Low risk Myanmar Thailand Vietnam Cambodia Philippines Brunei Malaysia Singapore Indonesia
We are committed to a very much greater global warming than today’s 0.8°C (only to 2100).
We are committed to much greater global warming than today’s 0.8°C (only to 2100). 1. Climate system science 3.0°C - 4.0°C (IPCC, NRC,) 2. Policy 4.4°C - >7.0°C (Climate Interactive, 2012) 3. Global emissions 6.0°C - >7.0°C (International Energy Agency, World Energy Outlook, 2011) 4. To limitwarming takes zero industrial carbon emissions (www.onlyzerocarbon.org) Warming lasts >1000 years (S. Solomon, 2009)
We are committed to much greater global warming than today’s 0.8°C (only to 2100). 1. Climate system science 3.0°C - 4.0°C (IPCC, NRC,) 2. Policy 4.4°C - >7.0°C (Climate Interactive, 2012) 3. Global emissions 6.0°C - >7.0°C (International Energy Agency, World Energy Outlook, 2011) 4. To limitwarming takes zero industrial carbon emissions (www.onlyzerocarbon.org) Warming lasts >1000 years (S. Solomon, 2009)
We are committed to much greater global warming than today’s 0.8°C (only to 2100). 1. Climate system science 3.0°C - 4.0°C (IPCC, NRC,) 2. Policy 4.4°C - >7.0°C (Climate Interactive, 2012) 3. Global emissions 6.0°C - >7.0°C (International Energy Agency, World Energy Outlook, 2011) 4. To limitwarming takes zero industrial carbon emissions (www.onlyzerocarbon.org) Warming lasts >1000 years (S. Solomon, 2009)
We are committed to much greater global warming than today’s 0.8°C (only to 2100). 1. Climate system science 3.0°C - 4.0°C (IPCC, NRC,) 2. Policy 4.4°C - >7.0°C (Climate Interactive, 2012) 3. Global emissions 6.0°C - >7.0°C (International Energy Agency, World Energy Outlook, 2011) 4. To limitwarming takes zero industrial carbon emissions (www.onlyzerocarbon.org) Warming lasts >1000 years (S. Solomon, 2009)
We are committed to much greater global warming than today’s 0.8°C (only to 2100). 1. Climate system science 3.0°C - 4.0°C (IPCC, NRC,) 2. Policy 4.4°C - >7.0°C (Climate Interactive, 2012) 3. Global emissions 6.0°C - >7.0°C (International Energy Agency, World Energy Outlook, 2011) 4. To limitwarming takes zero industrial carbon emissions (www.onlyzerocarbon.org) Warming lasts >1000 years (S. Solomon, 2009)
2. 4.4°Cby 2100
3. World economy emissions track 6°C ->7°C by 2100 Worst case high emissions scenario A1FI C2 emissions /year and IPCC scenarios A1FI 32 30 28 26 24 22 20 1990 1995 2000 2005 2010 International Energy Agency, World Energy Outlook, 2011
When could global warming reach 4°C? [-2060s] Richard A. Betts et al, Phil. Trans. R. Soc. A, 2011 3°C possible by 2050 World economy is fixed on worst case high emissions scenario A1FI 14.0 Realized/transient warming 14.0 13.0 12.0 11.0 10.0 9.0 8.0 7.0 6.0 5.0 4.0 3.0 2.0 1.0 8.0 3.0 5.5°C – 7.2°C Global average temperature increase from pre-industrial Realized/ transient warming by 2100 1900 20000 2050 2100 2100 When could global warming reach 4°C? (Betts et al, Phil. Trans. R. Soc. A, 2011)
The co The committed warming (from the ocean heat lag alone) is about double the transient warming Eventual equilibrium warming
Committed crop yield loss at 2080 Must plan for food according to committed unavoidable warming – not model-projected realized/transient warming Realized/transient warming Transient crop loss at 2050 Crop yield today
Must plan for food according to committed unavoidable warming – not model-projected realized/transient warming Ocean heat lag alone Committed crop loss at 2050
Committed unavoidable global warming 1. Climate system science 3-4°C (inertias) This approach works for anticipating crop losses
o 0.8°C 0.4°C 0.6°C 0.4°C 2.2°C 0.8°C o emissions Fastest emissions reduction to atmospheric greenhouse gas stabilization o 0.6°C Ocean heat lag delayed warming o O Aerosol cooling (air pollution) deferred warming will be unmasked when fossil fuels are replaced with clean zero carbon clean energy o o o Carbon feedbacks (terrestrial only) from a warming of 2.2°C IPCC 3.0°C
The 2°C limit is impossible and we could be committed to 4°C When could global warming reach 4°C? [-2060s] Richard A. Betts et al, Phil. Trans. R. Soc. A, 2011 Reframing the climate change challenge in light of post-2000 emission trends Kevin Anderson and Alice Bows, Phil. Trans. R. Soc. A, 2008 On avoiding dangerous anthropogenic interference with the climate system V. Ramanathan and Y. Feng, PNAS, 2008
uuu How do we plan now for future food?
uuu What’s the situation today?
The Economics of Climate Change in Southeast Asia: A Regional Review (Asia Development Bank, 2009) • At 0.8°C: there is already a "decline in agricultural production potential in many parts of the region" due to • INCREASING • heat stress • water stress • extreme weather events • floods • climate-associated pests • climate-associated diseases
Global climate change is irreversible • Irreversible climate change due to carbon dioxide emissions • Susan Solomon et al, PNAS, 2009 • We must plan according to • committed unavoidable warming
Processes not considered or adequately quantified in climate-crop models • critical thresholds • responses of weeds • responses of insects • responses of pathogens • changes in water resources available for irrigation • increased surface ozone levels • increased flood frequencies • extremely high temperatures • sustained droughts • year-to-year variability • soil salinization - sea level • floods • land degradation - soil erosion • COMBINED IMPACTS 10
We must plan adaptation, but there’s no evidence it will help above 2°C • Only response is an emergency response "Adaptation responses by growers are also poorly understood and could, in contrast, reduce yield losses." "More commonly, adaptations will at best be able to offset 2°C of local warming (Easterling et al., 2007), and they will be less effective in tropical regions where soil moisture, rather than cold temperatures, limits the length of the growing season." "Very few studies have considered the evidence for ongoing adaptations to existing climate trends and quantified the benefits of these adaptations." (Chapter 5, p. 162)
We can assume that • world food prices • are committed • to keep increasing • due to an increasing trend of • Northern Hemisphere drought • — severe NH drought at • today’s 0.8°C
N.H. drought = world food $s UCL Global Drought Monitor July 2012 Palmer Drought Severity Index PDSI University College London Hazard Research Centre
N.H. drought = world food $s UCL Global Drought Monitor July 2012 Palmer Drought Severity Index PDSI University College London Hazard Research Centre
Global Drought Monitor November 2012 Palmer Drought Severity Index PDSI
Assess first by • extreme weather events • A top determinant • of • food production • not accounted for in assessment models
Extreme Weather Events • the most damaging category of climate change effects on both crop yields and human health • these impacts compound each other • they are not modeled in assessments
Future extreme events and disasters will increase much more • The frequency and intensity of extreme weather events in Southeast Asia are likely to increase further, including more • drought • heat waves • flooding • intense precipitation events • tropical cyclones (more and more intense) • inter-annual variability of daily precipitation in the Asian summer monsoon • amplification in storm-surge heights • increased frequency and intensity of La Niña events Combined?
Drought Not accounted for in assessment models
Southeast Asia Increasing drought followed by increasing precipitation (Not modeled in assessments)
2.8°C 2.8°C
2.8°C 2.8°C
2.8°C drought, floods Vietnam Philippines Thailand Cambodia Malaysia Brunei Indonesia
Climate-Crop Computer Model Projection Results (Assume underestimates)
According to models, all crops in all regions will be in declining yields from 2.0°C global increase World food output is at risk from 1.5ºC C3 crops (rice, wheat, soybeans, fine grains, legumes) decline at roughly 1.25-2°C in global average temperature increase. For C4 crops (maize, millet, sorghum), even modest amounts of warming are detrimental in major growing regions given the small response to CO2. (NRC, Climate Stabilization Targets,Ch. 5, p. 160) At lower latitudes, especially seasonally dry and tropical regions, crop productivity is projected to decrease for even small local temperature increases of 1.0-2.0°C [0.8-1.8ºC global from pre-1900]. … global production potential […] is threatened at +1°C [1ºC global from pre-1900] local temperature change…. (IPCC, 2007, Figure 5.2 http://www.ipcc.ch/publications_and_data/ar4/wg2/en/ch5s5-4-2-2.html)
Climate-Crop Model Results Southeast Asia Asia Development Bank August 2010
Rice Yield Potential in Four Southeast Asian Countries and the World (from models) Rice yield potential in the four countries and world (models) 1.2 1.0 0.8 0.6 0,4 0.2 ADB 2009 -28% Yield potential - 1990 Climate crop model means Rice Big range Philippines huge losses +°C 1.0 2.0 3.0 4.5 5.5 from pre-1900 Mean temperature increase models 1990 2020 2040 2060 2080 2100 Vietnam World Indonesia Thailand Philippines
Crop yield reductions and price rises over the next 40 years (according to models) • Irrigated agriculture in the region is • expected to decline in the range of: • Rice 14-20% • Wheat 32-44% • Maize 2-5% • Soybean 9-18% • over the next 40 years • Food prices are expected to increase sharply by 2050compared to those predicted in the absence of climate change, with • Rice prices up 29-37% • Wheat prices up 81-102% • Maize prices up 58-97% • Soybean prices up 14-49% Asia Development Bank 2010
Crop Yield Reductions from Global Climate Change in Southeast Asia by 2050 Crop yield reductions from global climate change in S. E Asia by 2050 Asia Development Bank 2010 110 100 90 80 70 60 50 According to models Maize Soybean Rice Wheat 2.5°C - 3.0°C 1990 2020 2040 2060 2080 2100
Food Price Increases from Global Climate Change in Southeast Asia by 2050 100 80 60 40 20 Food price increases from global climate change in S. E Asia by 2050 Asia Development Bank 2010 According to models % increase Maize Soybean Rice Wheat 1990 2020 2040 2060 2080 2100