La Vernia Elementary STaR Chart Analysis
110 likes | 212 Vues
Analysis of the STaR Chart performance for La Vernia Elementary School faculty, measuring progress in key areas, highlighting strengths and weaknesses, comparing data, and setting targets. Report includes conclusions and suggestions for improvement.

La Vernia Elementary STaR Chart Analysis
E N D
Presentation Transcript
La Vernia ElementarySTaR Chart Analysis Report to the Faculty June 15, 2009
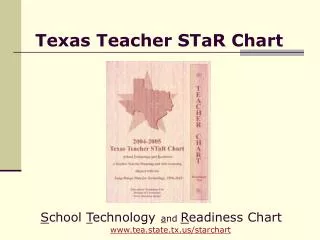
Measuring Performance • Required annual technology assessment • Comparability of progress data is essential • Texas STaR Chart assessment instrument • Teachers submit Teacher STaR Chart • Teacher results feed Campus STaR Chart
Chart Basis • STaR Chart based on the Texas LRPT (Long Range Plan for Technology) • LRPT divided into four domains: • Teaching and Learning • Educator Preparation and Development • Leadership, Administration and Instructional Support • Infrastructure for Technology • STaR Chart Key Area = LRPT Domain
Levels of Progress • Levels of Progress in STaR Chart Key Areas: • Early Tech • Developing Tech • Advanced Tech • Target Tech • Texas Education Agency sets goal to achieve Target Tech
Comparison by Key Area Total 6-8 = Early Tech 9-14 = Developing Tech 15-20 = Advanced Tech 21-24 = Target Tech NOTE: 2005/2006 A&S and IT totals not directly comparable due to STaR Chart design changes
Teaching and Learning 1 = Early Tech 2 = Developing Tech 3 = Advanced Tech 4 = Target Tech 2005/2006 Not directly comparable in this view due to STaR Chart design changes
Educator Preparation and Development 1 = Early Tech 2 = Developing Tech 3 = Advanced Tech 4 = Target Tech 2005/2006 Not directly comparable in this view due to STaR Chart design changes
Leadership, Administration and Instructional Support 1 = Early Tech 2 = Developing Tech 3 = Advanced Tech 4 = Target Tech 2005/2006 Not directly comparable in this view due to STaR Chart design changes
Infrastructure for Technology 1 = Early Tech 2 = Developing Tech 3 = Advanced Tech 4 = Target Tech 2005/2006 Not directly comparable in this view due to STaR Chart design changes
Conclusions • Greatest Strength: Infrastructure for Technology • Thin clients • Advanced wireless • Greatest Weakness: Teaching and Learning • Loss of supplemental grant funding • “The Sage on the Stage” syndrome • Marching orders • Follow the TEKS/TA-TEKS • Become “learning facilitators”