Download

1 / 17
170 likes | 289 Vues
The South Whidbey School District's demographics reflect a diverse student body: 87.9% White, 3.9% Hispanic, 1.7% Black, 3.5% Asian, and 3% Other. Although there have been significant improvements in science across the district, challenges remain in writing, which did not meet AYP standards. Comparisons with the state show that South Whidbey outperforms similar districts in reading, math, and writing. We are aligning our curriculum with state and Common Core standards, emphasizing high expectations and continuous improvement to ensure career and college readiness.

E N D
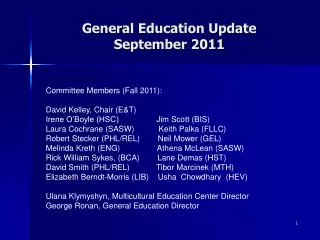
WHO ARE WE (AS OF May 2011)? • Demographics • 87.9% White • 3.9% Hispanic • 1.7% Black • 3.5% Asian • 3% Other • 28.5% Free/Reduced Lunch • 13.3% Special Education
Significantly improved Yet declines DID NOT MEET AYP
What is going on with writing?? Science improved across district!
HOW DO WE COMPARE WITH STATE? ALL HIGHER EXCEPT 4TH HIGHER
HIGHER HIGHER
HOW DO WE COMPARE WITH SIMILAR DISTRICTS? WHICH DISTRICTS SHOULD WE COMPARE OURSELVES TO?
HOW DO WE COMPARE WITH SIMILAR DISTRICTS? READING Marks highest of three districts
HOW DO WE COMPARE WITH SIMILAR DISTRICTS? MATH Marks highest of three districts
HOW DO WE COMPARE WITH SIMILAR DISTRICTS? WRITING Marks highest of three districts
HOW DO WE COMPARE WITH SIMILAR DISTRICTS? SCIENCE Marks highest of three districts
WHAT ARE WE TEACHING AND HOW ARE WE TEACHING IT? • ALIGNING CURRICULUM WITH STATE AND COMMON CORE STANDARDS • CURRICULUM BASED ASSESSMENTS PERIODICALLY THAT ALIGN TO STANDARDS • HIGH EXPECTATIONS-EVALUATION PROCESS • EVALUATE WHAT WE DO AND HOW THAT ALIGNS WITH CAREER/COLLEGE READINESS • DATA DIVING AND SHARING WITH TEACHERS
GOALS • DEFINED • LONG-TERM • CLEAR AND FOCUSED • CONTINUOUS IMPROVEMENT