Download
1 / 25
250 likes | 263 Vues
Problem Solving and RtI ASCA Conference Denver, 2007 Rich Downs School Counseling Consultant Student Support Services Project Florida Department of Education. Florida Department of Education. Today’s Agenda. Overview & use of a Problem-Solving Model to enhance student progress

E N D
Problem Solving and RtI ASCA Conference Denver, 2007 Rich Downs School Counseling Consultant Student Support Services Project Florida Department of Education Florida Department of Education
Today’s Agenda • Overview & use of a Problem-Solving Model to enhance student progress • Response to Intervention (RtI) within a Problem-Solving Model • Use of graphing as an RtI skill. • Resources
Why Problem-Solving ?BIG IDEAS • Annual Yearly Progress (AYP) and Disaggregated Data (NCLB) move focus of attention to student progress, not student labels • Building principals and superintendents want to know if students are achieving benchmarks, regardless of the students “type” • Accurate “placements” do not guarantee that students will be exposed to interventions that maximize their rate of progress • Effective interventions result from good problem-solving, rather than good “testing”
Big Ideas (con’t.) • Progress monitoring is done best with “authentic” assessment that are sensitive to small changes in student academic and social behavior interventions must be “evidence based” (IDEA/NCLB) • RtI is the best measure of problem “severity” • Program eligibility (initial and continued) decisions are best made based on RtI • Staff training and support (e.g., coaching) improve intervention skills • “Tiered” implementation improves service efficiency
Problem-Solving A process that uses the skills of professionals from different disciplines to develop and evaluate intervention plans that significantly improve the performance of students
Underpinning ideas • We can teach children. • Whether an intervention or teaching strategy is the “right one” can only be determined by implementing it, then monitoring student progress.
We Need A New Logic • Begin with the idea that the purpose of the system is student achievement • Acknowledge that student needs exist on a continuum rather than in typological groupings • Organize resources to make educational resources available in direct proportion to student need David Tilly 2004
Problem-Solving • Can be applied to the student, classroom, building and district levels • Student-academic and/or behavior problem • Classroom- discipline, returning homework • Building- bullying, attendance • District- over-/under-representation P=E-O (Problem=Expectation - Observation )
Problem-Solving: What It Is and Is Not • What it is…. • A process designed to maximize student performance • A method focused on outcomes • A method to ensure accountability and intervention evaluation • It is all about student progress, regardless of where or who that student is • What it is not… • A way to avoid special education placements • A less expensive way of schooling
Data-Based Decision Making A process in which school personnel engage in ongoing analysis of data from multilevel sources to provide a comprehensive picture of strengths and challenges and develop a plan to prioritize and address those challenges. Tung & Feldman, 2001
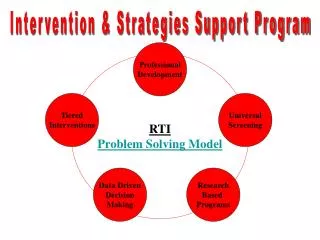
Response to Intervention (RtI) • A systematic and data-based method for determining the degree to which a student has responded to intervention. • Determined solely through analyzing data • Services should intensify for a student as the student response to intervention is below expectations. P=E-O
Why RtI ? BIG IDEAS • Accurate “placements” do not guarantee that students will be exposed to interventions that maximize their rate of progress • RtI is the best measure of problem “severity” • Program eligibility (initial and continued) decisions are best made based on RtI • “Tiered” implementation improves service efficiency
Three Tiered Model of School Supports Behavioral Systems Academic Systems Tier 3: Intensive, Individual Interventions Individual Students Assessment-based Intense, durable procedures Tier 3: Intensive, Individual Interventions Individual Students Assessment-based High Intensity of longer duration 1-5% 1-5% Tier 2: Targeted Group Interventions Some students (at-risk) High efficiency Rapid response 5-10% Tier 2: Targeted Group Interventions Some students (at-risk) High efficiency Rapid response 5-10% Students Tier 1: Universal Interventions All settings, all students Preventive, proactive 80-90% Tier 1: Universal Interventions All students Preventive, proactive 80-90%
RtI Implications • Poor/lack of instruction must be ruled out • Curricular access blocked by any of the following must be addressed • Attendance • Health • Mobility • Sufficient exposure to and focus on the curriculum must occur • Frequent, repeated assessment must be conducted
Response to Intervention (RtI) • Based on a 3-Tiered Model of Service Delivery • Universal (Core Curriculum) • Supplemental (Increase intensity/focus of curriculum) • Intensive (Individually developed intensive interventions) • A student’s “response to intervention” is the best indicator of the severity of the problem
Response to Intervention The “response” is measured by the rate of learning or the slope of the line on a graph We cannot ascertain whether a student has a “severe” problem unless evidence-based interventions are implemented and we monitor the students response to those interventions
Implications for School Counselors • Identification of “evidence-based” interventions for high rate student concerns • Identification of Tier 1 interventions • Identification of Tier 2 interventions • Identification of Tier 3 interventions • Methods to assess “response to intervention” in school counseling programs • We must relate student outcomes to service delivery
Case Studies • Two male students, Steven & Bart • Identical problems • Poor sight vocabulary • Word attack skills are lacking • Reading comprehension poor • Attendance & mobility are not an issue; both boys appear healthy; parents report no medical issues
Aimline= 1.50 words/week Trendline = 0.2.32 words/week
Aimline= 1.50 words/week Trendline = 0.95 words/week
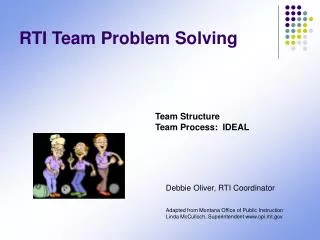
Tiers of Problem-Solving Problem Identification I II III Problem Analysis Response to Intervention Intervention Design
Take Home Messages • Problem-Solving/RtI is a paradigm shift • It will take time & training to reach proficiency • Whether an intervention is the “right one” can only be determined by implementing it, then monitoring student progress.
Resources • Response to Intervention: Policy Considerations and Implementation, NASDSE, 2005. • Response to Intervention: Principles and Strategies for Effective Practice, Brown-Chidsey, R & Steege M.W., Guilford, 2005. • RtI Response to Intervention: Training for California Educators, CA DOE, 2006, a set of DVD. • Florida Center for Reading Research, www.fcrr.org • Student Support Services Project, http://sss.usf.edu
Contact me Rich Downs rdowns@tempest.coedu.usf.edu 850.922.3732