FP420/AFP Timing
120 likes | 277 Vues
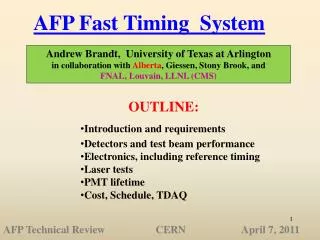
FP420/AFP Timing. Andrew Brandt (University of Texas, Arlington). Two types of Cerenkov detector are employed: QUARTIC – two QUARTIC detectors each with 4 rows of 8 fused silica bar allowing up to a 4-fold improvement over the single bar 40 ps measurement

FP420/AFP Timing
E N D
Presentation Transcript
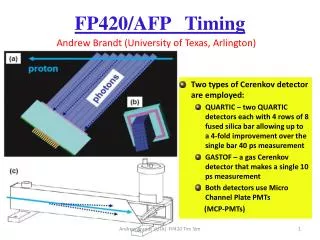
FP420/AFP Timing Andrew Brandt (University of Texas, Arlington) • Two types of Cerenkov detector are employed: • QUARTIC – two QUARTIC detectors each with 4 rows of 8 fused silica bar allowing up to a 4-fold improvement over the single bar 40 ps measurement • GASTOF – a gas Cerenkov detector that makes a single 10 ps measurement • Both detectors use Micro Channel Plate PMTs • (MCP-PMTs) Andrew Brandt (UTA) FP420 Tim Sim
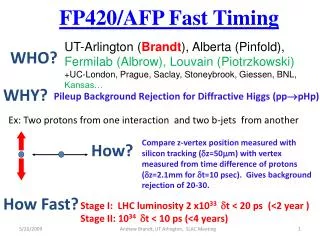
Overall ATLAS Timing Project Goals 1) Develop, fund, build, and install a fast timing detector system capable of <20 ps measurement in early 2011 2) Develop, fund, build, and install a fast timing detector system capable of <10 ps measurement and operation at high luminosity in early 2013 (this adds rate, lifetime, and multiple proton timing concerns) Note to Mike: For AFP (220 m +420 m detectors) need to time all protons in event over a 25 mm x 25 mm area! (if only doing 420 m, area is smaller and multiple proton timing is less important) Andrew Brandt (UTA) FP420 Tim Sim
Simulation Goals 1) Produce an accurate simulation of timing detectors for detector development 2) Include a baseline detector in full simulation for studies of background in detector 3) Focus and coordinate effort where possible to minimize duplication of effort and maximize usefulness Andrew Brandt (UTA) FP420 Tim Sim
Simulation Organization • On the ATLAS side the overall software coordinator is Mario Campanelli. • AnatoliAstvatsatourov will be coordinating the ATLAS timing detector simulation effort. I am hoping to fade into the background and have Anatolitake over running these meetings and get back to detector development after kick starting this effort. • If CMS would like to propose a counterpart to Anatoli to help coordinate this effort, please do. Andrew Brandt (UTA) FP420 Tim Sim
Detector Design Tools 1) Imagination 2) Ray tracing simulation (custom or Cyber Ray) 3) GEANT Simulation 4) Laser test stand 5) Test beam Andrew Brandt (UTA) FP420 Tim Sim
UTA Ray Tracing Simulation of QUARTIC 15 mm bar/75 mm aluminized air light guide 20 ps ~ 5 pe’s accepted in 20 ps 20 ps Andrew Brandt (UTA) FP420 Tim Sim
QUARTIC 90 mm bar/0 mm guide 40 ps 40 ps ~ 10 pe’s accepted in 40 ps 40 ps Andrew Brandt (UTA) FP420 Tim Sim
2008 QUARTIC Prototype Note: prior to June 2008 test beam, results marginal for QUARTIC 15mm bar: 80 ps/bar 80% efficient; allows you to reach close to 20 ps, but not 10 ps HC HH HE Testing long bars 90 mm (HE to HH) and mini bars 15 mm (HA to HD) Long bars more light from total internal reflection vs. losses from reflection in air light guide, but more time dispersion due to n() Andrew Brandt (UTA) FP420 Tim Sim
QUARTIC Timing 2008 CERN TB Dt Npe=(area/rms)2 56.6/1.4=40 ps/bar including CFD! Time difference between two 9 cm quartz bars after Louvain constant fraction discrimination is 56 ps, implies a single bar resolution of 40 ps for about 10 pe’s (expected 10 pe’s from simulations).
FNAL Beam tests give 20-30 ps resolution from Quartz bar, this is consistent with CERN TB results ~40 ps total for bar +Burle MCP-PMT combined with UTA Laser tests which show ~30 ps from Burle MCP-PMT. (30+30=40!) B Includes electronics (~3 ps) and 2 mm beam width smear (A,B) Δt = 2 mm x (10 ps/2 mm) C A
Questions that simulation combined with laser/test beam can address • How many accepted pe’s as a function of bar cross section area, length, and angle • Time and wavelength distribution of pe’s • What photocathode is optimal • Is filtering light in a certain wavelength range beneficial • Can we use quartz fibers, or some other lower index fiber instead of quartz bars—could improve binning and rate/lifetime issues, lead to other designs • How do different MCP-PMT’s respond to light that arrives at different times (UTA laser guys are working on this as we speak) Andrew Brandt (UTA) FP420 Tim Sim
Conclusions • Simulation is important-lets get coordinated • Better to simulate first and build later (often we get this backwards) • Combining simulation with laser and test beam efforts would optimize fast timing effort Andrew Brandt (UTA) FP420 Tim Sim