Download
1 / 19
190 likes | 217 Vues
This crash course on graphing explores how scientists organize and interpret data through tables, charts, and graphs. It covers essential questions such as selecting the appropriate type of graph for different data sets and understanding the benefits of graphing in scientific endeavors.

E N D
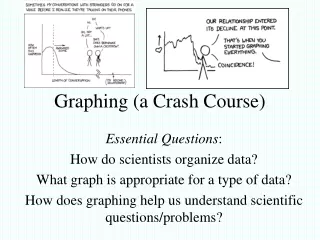
Graphing (a Crash Course) Essential Questions: How do scientists organize data? What graph is appropriate for a type of data? How does graphing help us understand scientific questions/problems?
Why Graph? • When performing an experiment, a scientist must be able to record an immense amount of data and process that data into useful information. • This is done by converting raw data into charts or tables. • Then, the data must be graphed such that it can be interpreted by the public. • Graphs are visual representations of data.
Part 1: Tables and Charts • Tables and charts are created for organizing data from raw data. • The chart should show how a trend occurs over several occurrences, (months, trials, categories, etc.) or over time. • Once data is organized, it can be graphed!
Discuss with Partners • When you see a data table or data chart how do you determine what is the independent variable and what is the dependent variable?
Part 2: Graphing DataA) Pie Graphs • Pie graphs are useful in showing percentages, parts of the whole. • Displays how different categories are represented within a topic area. • Sample: How many land does Asia take up in the world?
Part 2: Graphing Data B) Bar Graphs • A bar graph is a way of showing relationships between variables, typically items that being compared. • It contains an x and y axis. • These are 2 lines that meet at a right angle. • It uses a series of columns to display data. • Example, how does the number of farms in 1910 compare with 1990? • Notice: • The x and y axis are always labeled. • The graph has a title. • The bars are vertical. • The numbers on the Y axis are in sequence for an accurate comparison. Year
Part 2: Graphing Data C) Line Graphs • A line graph shows the best relationship between 2 variables. • Along the x-axis (horizontal) is the manipulated or independent variable. • Along the y-axis (vertical) is the responding or dependent variable. • Has one or more lines connecting a series of points. • Notice: • Time is on the x-axis (independent variable) • Distance is on the y-axis (dependent variable) • Distance and time are in sequence.
Discuss with your group • DRY MIX • What is it and what does it mean? • 1 minute D = Dependent variable R = Responding variable Y = y-axis M = Manipulated variable I = Independent variable X = x-axis
Relationship Between Variables • The relationship between the variables presented in line graphs is called correlation. • This is why information is put into the line graph format in the first place. • There are three types. • Positive = Positive slope • Negative = Negative slope • No Correlation = No general trend present. • Sometimes the correlation is perfect but most of the time data isn’t perfect…it requires interpretation. • Interpreting the graph is the key to establishing the relationship between the independent and dependent variables.
Dependent Variable Independent Variable X-Y Scatter Plots: Line Graphs • Positive Correlation. • Negative Correlation. • No Correlation. • Realistic Data and its Correlation. • What does the realistic correlation look like? • What kind of correlation is shown?
Practice • Get into groups.
Creating and Interpreting Graphs • Class Practice… • Many people have pets. One survey of pet owners showed the following breakdown of the type of pets owned: 35% dogs; 35% cats; 10% birds; 5% hamsters, gerbils, mice, rats; 5% reptiles; and 10% other. You would use a pie chart for this. • Complete the graph using the survey data. Estimate the angle of each section of your completed circle graph. Use rulers & protractors for neatness. Give your graph a title and label what each section of the graph represents. • What’s the point of the circle graph and explain how viewing the graph conveys information to the reader more quickly than reading the list of data.
35% dogs; 35% cats; 10% birds; 5% hamsters, gerbils, mice, rats; 5% reptiles; and 10% other.
Circle Graph Dogs 35% Cats 35% Hamsters, gerbils, mice, rats 5% Reptiles 5% Other 10% Birds 10%
Constructing a graph • Decide which variable to place along the x and y axis. • Decide on a scale for your graph. • Start by discussing with your group. How do you determine the scale to use for a graph? • Must be as large as possible within the limits of the paper and still include the largest item of data. • Select your scale with ease of locating points, multiples of 1, 2, 5, or 10 are easiest. • Your Turn! Use the back side & complete the graph.
Graph the following data Concentration of Oxygen in Water
Temperature v O2 Concentration Oxygen Concentration (ppm) Temperature °C
Create A Line Graph (25pts)This is actual made-up data… • Hypothesis: Doing homework improves test grades. • Name Test Grade (Y)Homework Grade (X)Rob 61 35Thomas 95 50Mark 44 5Wanda 93 50Judy 63 15Haydn 80 36Barbara 62 16Karen 95 50Marilyn 65 7Phil 88 38 Joe 56 12 Sheri 74 41 • Directions: Create a heading for the X-axis and Y-axis & choose a useful scale (you must start from zero). Plot these data points on the graph provided. Draw a best fit line to better illustrate the general trend of the data. Make sure your finished graph is titled. • What type of correlation does this represent? • What does this say about the data? Really think about this. Is there a relationship between the X-values and the Y values in general? • What do you think the hypothesis was for this experiment? • Which set of datum shows the independent variable? Which shows the dependent variable?
Test Grade Homework Grade