Download
1 / 37
370 likes | 540 Vues
Learn how to create forms, queries, and reports in a database using various tools and features. Explore table structures, query design, and printing options. Get hands-on guidance for effective database management.

E N D
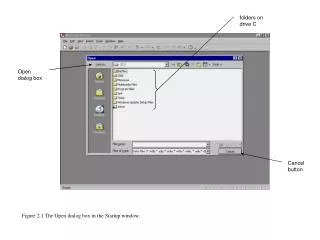
folders on drive C Open dialog box Cancel button Figure 2.1 The Open dialog box in the Startup window.
Print button type form wiz in this text box help on creating a form Create a form topic Figure 2.2 Obtaining help.
highlighted database click to open the highlighted database click to cancel open Figure 2.3 Preparing to open a database.
Database window tables, queries, and other database objects on the Object bar four tables comprise this database Figure 2.4 The Database window.
menu bar toolbar three cascaded windows Expand buttons minimized window containing the tblBroker table Figure 2.5 Icons and cascaded windows.
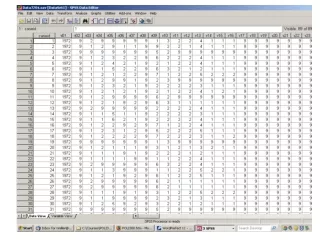
each column holds a different characteristic about the row it describes this value shows the total number of rows in the table the primary key column’s values by definition are unique for each row Figure 2.6 Example table containing employee data.
query design query dynaset Figure 2.7 Example query and dynaset.
text boxes navigation buttons Figure 2.8 Example form displaying an Employee table row.
the Look in drop-down list database file Figure 2.10 Open Database dialog box.
comments about each table list of tables in the database Figure 2.11 Database window.
Datasheet view Form view Figure 2.12 Two views of the same data.
tblClient table among a list of tables Datasheet view of tblClient Figure 2.13 The Client table (tblClient).
New Record Filter By Selection Cut Save Help Undo Apply Filter Sort Ascending Print Preview Database Window Paste Print Copy Insert Hyperlink Filter By Form Delete Record Spelling View Format Painter Sort Descending New Object Find Figure 2.14 Table Datasheet view toolbar.
selected (network) printer designates which pages to print number of copies to print Figure 2.16 Print dialog box.
click other tabs to select additional objects four tables are selected select all objects in a window Figure 2.17 Using Documentor to print out table structure information.
dynaset table field roster query design query grid Figure 2.18 A query design and resulting dynaset.
QBE grid Show row selection criteria Figure 2.20 One-table query, Design view.
only rows with 1015 for ClientID are selected for the dynaset Figure 2.21 One-table query dynaset.
dynaset query design selection criteria Figure 2.22 Selection and projection operations with an and operator used in the criteria.
multiple criteria on two different criteria rows implements an OR between the criteria Figure 2.25 OR query and dynaset.
New Object button dynaset query design calculated expression Figure 2.26 A query calculating a value with an expression.
BrokerSalary is replaced by the value of this expression only rows containing “F” are updated Figure 2.28 An update query example.
delete criteria Figure 2.29 A delete query example.
append values from this table to tblEmployee field names need not match Figure 2.30 An append query example.
the number of records in the tblClient table current record number Next Record button Figure 2.31 A client form.
no minimize or maximize button is available record count Figure 2.32 Form based on the query, qryStockValue.
Apply Filter/Remove Filter ClientID drop-down list Figure 2.34 Filter By Form example.