Download

1 / 4
40 likes | 151 Vues
Explore employment data for Dronninglund Municipality from 1996-2005. Analyze average number of unemployed and unemployment rates. Engage with insightful figures and tables prepared by Aalborg Municipality's Economics Office.

E N D
Figur 1: Antal ledige i procent af arbejdsstyrken 2005 Pandrup Aabybro Dronninglund Fjerritslev Brovst Hals Aalborg Nibe Løgstør Sejlflod Støvring Skørping Bearbejdet af: Økonomikontoret, Aalborg Kommune
Figur 2: Det gennemsnitlige antal ledige og ledige i procent af arbejdsstyrken i Dronninglund Kommune 2001-2005 Bearbejdet af: Økonomikontoret, Aalborg Kommune
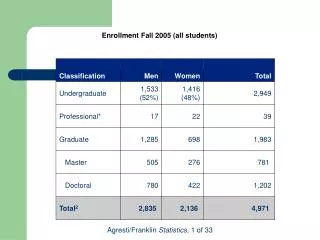
Tabel 1: Det gennemsnitlige antal ledige i Dronninglund Kommune Bearbejdet af: Økonomikontoret, Aalborg Kommune
Figur 3: Udviklingen i det gennemsnitlige antal ledige i procent af arbejdsstyrken i Dronninglund Kommune 1996-2005 Bearbejdet af: Økonomikontoret, Aalborg Kommune