Download
1 / 18
320 likes | 638 Vues
Macroeconomics Basic Model & Economic Relationships. Circular Flow Diagram The Circular Flow diagram is the most basic macroeconomic model. It shows the basic flow of economic goods and money through the economy. The economy is essentially a “self contained” system.

E N D
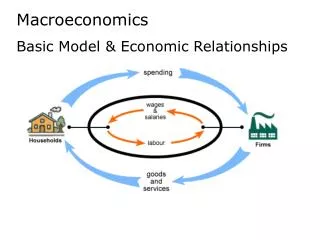
Macroeconomics Basic Model & Economic Relationships
Circular Flow Diagram The Circular Flow diagram is the most basic macroeconomic model. It shows the basic flow of economic goods and money through the economy. • The economy is essentially a “self contained” system. • Money (spending and wages) is a “tool” for exchanging resources. It is not a resource, instead it facilitates the transaction of resources in the economy (i.e. makes it easy to buy and sell). • People are both producers and consumers – basic point that both production and consumption are important to the economy, and that the goal of an economy is to balance the productive and allocative needs in the economy.
Why Economists Like Math Mathematical equations can be a more exact and efficient way to explain complex ideas and show relationships than written prose. For example, these mean the same thing: Q = f (P) Quantity is a function of Price Mathematical models can be tested against “real” world statistical data to see if they are accurate. Most economists view that models should be first built on theory and then tested against statistical data to avoid issues of causation and correlation.
Reasons Economists Use Math Economist Noah Smith said, So why should we use math in economics? Well, I can think of a number of reasons: 1. We may want to make precise predictions about what will happen in a market. 2. We may want to make precise predictions about the conditions under which things will happen in a market. 3. Precise statements often help resolve debates, avoiding the phenomenon of "talking past each other". 4. Precise statements often lead to unintuitive but logically inescapable results. 5. It is usually easier to check sets of precise statements for logical inconsistencies.
Digression on Regression Analysis Economists use a process called econometrics to do the statistical analysis of economic models. Econometrics is basically the combination of economic theory and statistics. Economist use a technique called “regression analysis” to convert a set of data point into a linear or non-linear equation that can be analyzed to measure the cause and effect relationship that is part of an economic model. Basically, regression analysis calculates the “best fit” line for a set of data. Economists can then use other statistical tools for testing the accuracy of the equation to the underlying data. However, statistics cannot, by itself, show the actual existence of a causal relationship, that is the realm of economic theory. Economic theory is used to explain the existence of a relationship and statistics is used to confirm whether the relationship actually exists.
Regression Analysis and Correlation Regression analysis is used to find a significant relationship or correlation between economic events. The graphs below show different relationships between the variables “X” and “Y”, where “X” is the independent variable and “Y” is the dependent variable → Y = f(X).
Mathematics is a language that economists use to express relationships. Understanding how to read equations is important (and can be used to reinforce economic concepts) For example: Q = f (P) Means Quantity is a function of Price Based on this relationship, it is obvious that changes in price will effect quantity. This is written as: Means A change in price will affect the quantity (Equations are read denominator to numerator) Means A change in price will negatively affect the quantity (There is a negative relationship) Mathematically, this is the first derivative and it is the slope of the line. Economists use the term “marginal” to note the first derivative.
Basic Macroeconomic Model The macroeconomy can be summed up in a basic model that is comprised of the components of the economy. This model takes the form: Y = C + I + G + NX Y = Gross Domestic Product or Net Income C = Consumption I = Investment G = Government government spending minus taxes NX = Net Exports exports minus imports This simple model can be used to gain a number of insights into the working of the macroeconomy. The model clearly shows the parts of the economy economists watch when trying to predict future GDP. If there is a change in consumption, investment, government spending or net exports, it will affect GDP.
Underlying Factors of Macroeconomy This model can be expanded to reveal deeper workings of the economy by factoring in what effects each part of the macroeconomy. This model will take the form: Y = C(Y) + I(r) + G + NX (e) r = real interest rate e = exchange rate This expansion of the model shows the underlying factors that economists focus on in trying to predict how the parts of the macroeconomy could change and how that will affect GDP.
Consumption The first part of the equation notes the relationship that consumption is both a factor of income and is affected by income. Consumption levels are a function of the amount of income they earn. Y = f (C) and C = f (Y) This is a positive relationship - people consume more when incomes rise which increases net income even more. The opposite is true when incomes go down. dY/ dC > 0 anddC/ dY > 0 Consumption is the largest part of the macroeconomy, representing roughly 70% of the economy.
Underlying Factors that Affect Consumption There are many factors that influence the amount that is spent on consumption that are based on the amount of income people currently have, the amount of income people expect to have in the future and the value of assets they own. The rate of employment (or unemployment) has a large effect on consumption. If the unemployment rate is high people do not have income or if they fear they may lose their job they will cut back on spending (to build up savings), which will reduce the rate of consumption. The wealth effect based on rising or declining asset prices (such as houses or stocks). If assets are increasing in value, then people will feel wealthier and spend more income on consumption. The opposite holds when asset prices are declining. In this recession Americans lost $ 11 trillion in wealth. Consumer expectations will effect consumption spending. Consumer expectations are affected by issues of future employment, price level (inflation) and changes in wealth.
Investment The second part of the equation is the relationship between net income, the level of investment and the interest rate. In this case, it is important to track both relationships. First, the relationship between the rate of investment and net income is positive – increases in investment cause increases in net income. Y = f (I) anddY/ dI > 0 This relationship is because investment spending represents a demand for current resources, which is part of current GDP.
Interest Rate & Investment Second, the relationship between the interest rate and the rate of investment is negative. As the interest rate increases, it makes investment more expensive, which causes the amount of investment to go down. I = f (r) and dI/ dr < 0 In total, an increase in the interest rate has a negative affect on net income as an increase in the interest rate causes a decrease in investment, which reduces net income. Y = f (r) and dY/ dr < 0 It is important to note that investment here does not indicate savings. The relationship between the rate of investment and the rate of savings is an important debate between economists.
Underlying Factors that Affect Investment There are many factors that influence the amount that is spent on investment that are based on the amount of current capital and expectations of future profits. The rate of capital utilization indicates how much current capital is being used by industry. The higher the rate of utilization means the more likely new investment will be profitably employed – which should mean more investment. The lower the rate, the less investment. Capital utilization is like the unemployment rate for capital. Changes in productivity are an indication of whether capital will be more profitable. If there are gains in productivity, it means there should be more investment because capital should be more profitable. Lower productivity should indicate a decline in investment. Investor and business expectations influenced by predictions of profit and loss will affect the amount of investment.
Government The third component of the macroeconomy is the government. This part of the model is based on political action – the decisions the government makes about taxation and spending in the economy. In the model, net government spending equals the amount of government spending minus government revenue (taxes). G = government spending – taxes This part of the model can operate independently of the rest of the business cycle – economists consider government to be an “exogenous” factor since its value is determined outside of the outside of the model and is not explained solely by economic factors or the model. The amount of government spending is determined by the political process. In this way, government spending in macroeconomic policy can dampening down the effect of the business cycle by acting as a counter weight to other factors in the model.
Net Exports The final part of the macroeconomic model is net exports or exports minus imports. NX = exports - imports This part of the model, like investment, is a made up of two relationships: net income to net exports and net exports to the exchange rate. First, an increase in net exports has a positive effect on net income. As net exports increase, income will also increase. This is because exports represent income for people in a country and imports represent spending on good from other countries. Y = f (NX) and dY/ dNX > 0
Exchange Rates and Net Income Second, the amount of net exports is directly affected by the exchange rate. This is because the exchange rate affects the relation of prices in one currency to prices in another currency. For example, if the same good costs ten euros and ten dollars, they are only the same price if the exchange rate is $ 1: €1. For this reason, increase in the exchange rate indicates that the currency has gained value compared to other currencies. This makes goods in other countries cheaper and people will tend to buy cheaper imported goods. This increase in the exchange rate will cause a decline in net exports - people to import more and export less. As a result, of the decline in net exports, net income will decline. Therefore, there is a negative relationship between the exchange rate and net income. Y = f (e) and dY/ de < 0
Use of the Model It is important to remember that this is a simple model that does not consider in additional factors in the economy (such as expectations of the future or increases in productivity) or the way some factors affect each other (such as the effect of changes on interest rates on exchange rates or consumption). This model can be expanded on to include additional factors, such as those listed above. Still, in its basic form, the relationships outlined in the model can make it useful for analyzing and understanding the changes in the macroeconomy.