Reconstruction of Potential Fields and Magnetic Field Lines in Sumer Region Analysis
110 likes | 246 Vues
This study presents a detailed reconstruction of potential fields in the Sumer region, utilizing Alpha*L variations and EIT data from 1996. Various grid configurations and magnetic field line evaluations were conducted to understand the behavior of closed flux and its implications. Data sets at different altitudes (0 Mm, 3 Mm, and 10 Mm) were analyzed to illustrate magnetic field line patterns and angles relative to vertical components. The findings enhance our comprehension of magnetic field dynamics and their spatial distribution, contributing valuable insights for further research in geophysical phenomena.

Reconstruction of Potential Fields and Magnetic Field Lines in Sumer Region Analysis
E N D
Presentation Transcript
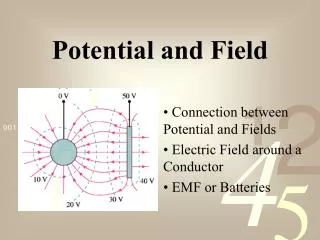
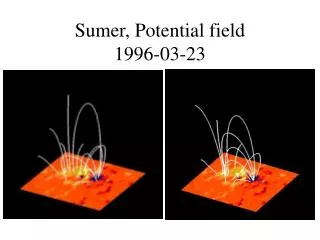
MDI, 2.8.1996 u=353 596 275 458 Potential Field reconstruction
Alpha*L=2.0 EIT, 2.8.1996 potential
Some Loops fitted Alpha*L=-1.0 Different z (very rough grid dAlpha=1, dz=5)
Same field lines as on left hand side Some loops for alpha*L=-2.0 KP and EIT data. U=750 1000 1000 1200
Field lines for |Bz|>50 G Every 10 pixel
Bz, 0 Mm |B| Bz, 3 Mm |B| Bz, 10 Mm |B|
Angle(B,ez), 0Mm 3 Mm 10 Mm