Download
1 / 37
370 likes | 374 Vues
This lecture provides a review of various topics including pipelining, performance, caches, and virtual memory in digital systems architecture.

E N D
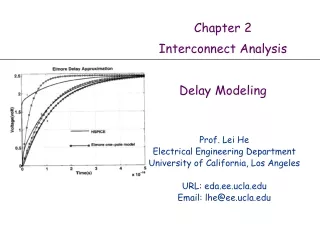
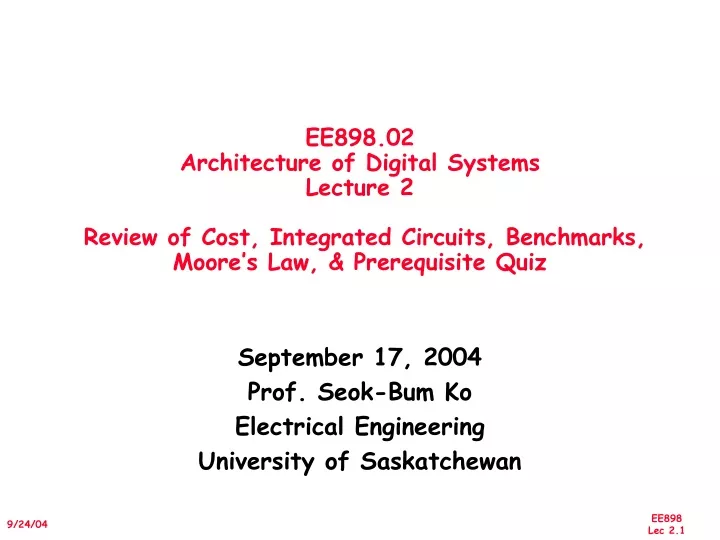
EE898.02Architecture of Digital SystemsLecture 2 Review of Cost, Integrated Circuits, Benchmarks, Moore’s Law, & Prerequisite Quiz September 17, 2004 Prof. Seok-Bum Ko Electrical Engineering University of Saskatchewan
Review #1/3: Pipelining & Performance • Just overlap tasks; easy if tasks are independent • Speed Up Pipeline Depth; if ideal CPI is 1, then: • Hazards limit performance on computers: • Structural: need more HW resources • Data (RAW,WAR,WAW): need forwarding, compiler scheduling • Control: delayed branch, prediction • Time is measure of performance: latency or throughput • CPI Law: CPU time = Seconds = Instructions x Cycles x Seconds Program Program InstructionCycle
Review #2/3: Caches • The Principle of Locality: • Program access a relatively small portion of the address space at any instant of time. • Temporal Locality: Locality in Time • Spatial Locality: Locality in Space • Three Major Categories of Cache Misses: • Compulsory Misses: sad facts of life. Example: cold start misses. • Capacity Misses: increase cache size • Conflict Misses: increase cache size and/or associativity. • Write Policy: • Write Through: needs a write buffer. • Write Back: control can be complex • Today CPU time is a function of (ops, cache misses) vs. just f(ops): What does this mean to Compilers, Data structures, Algorithms?
size of information blocks that are transferred from secondary to main storage (M) block of information brought into M, and M is full, then some region of M must be released to make room for the new block --> replacement policy which region of M is to hold the new block --> placement policy missing item fetched from secondary memory only on the occurrence of a fault --> demand load policy disk mem cache reg pages frame Basic Issues in VM System Design Paging Organization virtual and physical address space partitioned into blocks of equal size page frames pages
V = {0, 1, . . . , n - 1} virtual address space M = {0, 1, . . . , m - 1} physical address space MAP: V --> M U {0} address mapping function Address Map n > m MAP(a) = a' if data at virtual address a is present in physical address a' and a' in M = 0 if data at virtual address a is not present in M a missing item fault Name Space V fault handler Processor 0 Secondary Memory Addr Trans Mechanism Main Memory a a' physical address OS performs this transfer
V.A. P.A. Paging Organization unit of mapping 0 frame 0 1K Addr Trans MAP 0 1K page 0 1024 1 1K 1024 1 1K also unit of transfer from virtual to physical memory 7 1K 7168 Physical Memory 31 1K 31744 Virtual Memory Address Mapping 10 VA page no. disp Page Table Page Table Base Reg Access Rights actually, concatenation is more likely V + PA index into page table table located in physical memory physical memory address
miss VA PA Trans- lation Cache Main Memory Virtual Address and a Cache CPU hit data • It takes an extra memory access to translate VA to PA • This makes cache access very expensive, and this is the "innermost loop" that you want to go as fast as possible • ASIDE: Why access cache with PA at all? VA caches have a problem! • synonym / alias problem:two different virtual addresses map to same physical address => two different cache entries holding data for the same physical address! • for update: must update all cache entries with same physical addressor memory becomes inconsistent • determining this requires significant hardware: essentially an associative lookup on the physical address tags to see if you have multiple hits • or software enforced alias boundary: same lsb of VA & PA > cache size
TLBs A way to speed up translation is to use a special cache of recently used page table entries -- this has many names, but the most frequently used is Translation Lookaside Buffer or TLB Virtual Address Physical Address Dirty Ref Valid Access Really just a cache on the page table mappings TLB access time comparable to cache access time (much less than main memory access time)
Translation Look-Aside Buffers Just like any other cache, the TLB can be organized as fully associative, set associative, or direct mapped TLBs are usually small, typically not more than 128 - 256 entries even on high end machines. This permits fully associative lookup on these machines. Most mid-range machines use small n-way set associative organizations. hit miss VA PA TLB Lookup Cache Main Memory CPU Translation with a TLB miss hit Trans- lation data t 1/2 t 20 t
Reducing Translation Time Machines with TLBs go one step further to reduce # cycles/cache access They overlap the cache access with the TLB access: high order bits of the VA are used to look in the TLB while low order bits are used as index into cache
Overlapped Cache & TLB Access Cache TLB index assoc lookup 1 K 32 4 bytes 10 2 00 Hit/ Miss PA Data PA Hit/ Miss 12 20 page # disp = IF cache hit AND (cache tag = PA) then deliver data to CPU ELSE IF [cache miss OR (cache tag = PA)] and TLB hit THEN access memory with the PA from the TLB ELSE do standard VA translation
Overlapped access only works as long as the address bits used to index into the cache do not changeas the result of VA translation This usually limits things to small caches, large page sizes, or high n-way set associative caches if you want a large cache Example: suppose everything the same except that the cache is increased to 8 K bytes instead of 4 K: Problems With Overlapped TLB Access 11 2 cache index 00 This bit is changed by VA translation, but is needed for cache lookup 12 20 virt page # disp Solutions: go to 8K byte page sizes; go to 2 way set associative cache; or SW guarantee VA[13]=PA[13] 2 way set assoc cache 1K 10 4 4
SPEC: System Performance Evaluation Cooperative • First Round 1989 • 10 programs yielding a single number (“SPECmarks”) • Second Round 1992 • SPECInt92 (6 integer programs) and SPECfp92 (14 floating point programs) • Compiler Flags unlimited. March 93 of DEC 4000 Model 610: spice: unix.c:/def=(sysv,has_bcopy,”bcopy(a,b,c)= memcpy(b,a,c)” wave5: /ali=(all,dcom=nat)/ag=a/ur=4/ur=200 nasa7: /norecu/ag=a/ur=4/ur2=200/lc=blas • Third Round 1995 • new set of programs: SPECint95 (8 integer programs) and SPECfp95 (10 floating point) • “benchmarks useful for 3 years” • Single flag setting for all programs: SPECint_base95, SPECfp_base95
SPEC: System Performance Evaluation Cooperative • Fourth Round 2000: SPEC CPU2000 • 12 Integer • 14 Floating Point • 2 choices on compilation; “aggressive” (SPECint2000,SPECfp2000), “conservative” (SPECint_base2000,SPECfp_base); flags same for all programs, no more than 4 flags, same compiler for conservative, can change for aggressive • multiple data sets so that can train compiler if trying to collect data for input to compiler to improve optimization
How to Summarize Performance • Arithmetic mean (weighted arithmetic mean) tracks execution time: (Ti)/n or (Wi*Ti) • Harmonic mean (weighted harmonic mean) of rates (e.g., MFLOPS) tracks execution time: n/(1/Ri) or n/(Wi/Ri) • Normalized execution time is handy for scaling performance (e.g., X times faster than SPARCstation 10) • But do not take the arithmetic mean of normalized execution time, use the geometric mean: ( Tj / Nj )1/n
SPEC First Round • One program: 99% of time in single line of code • New front-end compiler could improve dramatically
Impact of Means on SPECmark89 for IBM 550 Ratio to VAX: Time:Weighted Time: Program Before After Before After Before After gcc 30 29 49 51 8.91 9.22 espresso 35 34 65 67 7.64 7.86 spice 47 47 510 510 5.69 5.69 doduc 46 49 41 38 5.81 5.45 nasa7 78 144 258 140 3.43 1.86 li 34 34 183 183 7.86 7.86 eqntott 40 40 28 28 6.68 6.68 matrix300 78 730 58 6 3.43 0.37 fpppp 90 87 34 35 2.97 3.07 tomcatv 33 138 20 19 2.01 1.94 Mean 54 72 124 108 54.42 49.99 Geometric Arithmetic Weighted Arith. Ratio 1.33 Ratio 1.16 Ratio 1.09
Performance Evaluation • “For better or worse, benchmarks shape a field” • Good products created when have: • Good benchmarks • Good ways to summarize performance • Given sales is a function in part of performance relative to competition, investment in improving product as reported by performance summary • If benchmarks/summary inadequate, then choose between improving product for real programs vs. improving product to get more sales;Sales almost always wins! • Execution time is the measure of computer performance!
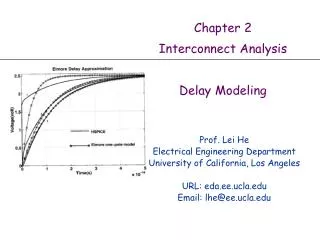
Integrated Circuits Costs Die Cost goes roughly with die area4
Real World Examples Chip Metal Line Wafer Defect Area Dies/ Yield Die Cost layers width cost /cm2 mm2 wafer 386DX 2 0.90 $900 1.0 43 360 71% $4 486DX2 3 0.80 $1200 1.0 81 181 54% $12 PowerPC 601 4 0.80 $1700 1.3 121 115 28% $53 HP PA 7100 3 0.80 $1300 1.0 196 66 27% $73 DEC Alpha 3 0.70 $1500 1.2 234 53 19% $149 SuperSPARC 3 0.70 $1700 1.6 256 48 13% $272 Pentium 3 0.80 $1500 1.5 296 40 9% $417 • From "Estimating IC Manufacturing Costs,” by Linley Gwennap, Microprocessor Report, August 2, 1993, p. 15
Average Discount Gross Margin Component Cost Cost/PerformanceWhat is Relationship of Cost to Price? • Component Costs • Direct Costs(add 25% to 40%) recurring costs: labor, purchasing, scrap, warranty • Gross Margin(add 82% to 186%) nonrecurring costs: R&D, marketing, sales, equipment maintenance, rental, financing cost, pretax profits, taxes • Average Discountto get List Price (add 33% to 66%): volume discounts and/or retailer markup List Price 25% to 40% Avg. Selling Price 34% to 39% 6% to 8% Direct Cost 15% to 33%
Chip Prices (August 1993) • Chip Area Mfg. Price Multi- Comment • mm2 cost plier • 386DX 43 $9 $31 3.4 Intense Competition • 486DX2 81 $35 $245 7.0No Competition • PowerPC 601 121 $77 $280 3.6 • DEC Alpha 234 $202 $1231 6.1Recoup R&D? • Pentium 296 $473 $965 2.0 Early in shipments • Assume purchase 10,000 units
Original Big Fishes Eating Little Fishes
1988 Computer Food Chain Mainframe Work- station PC Mini- computer Mini- supercomputer Supercomputer Massively Parallel Processors
1998 Computer Food Chain Mini- supercomputer Mini- computer Massively Parallel Processors Mainframe Work- station PC Server Now who is eating whom? Supercomputer
Why Such Change in 10 years? • Performance • Technology Advances • CMOS VLSI dominates older technologies (TTL, ECL) in cost AND performance • Computer architecture advances improves low-end • RISC, superscalar, RAID, … • Price: Lower costs due to … • Simpler development • CMOS VLSI: smaller systems, fewer components • Higher volumes • CMOS VLSI : same dev. cost 10,000 vs. 10,000,000 units • Lower margins by class of computer, due to fewer services • Function • Rise of networking/local interconnection technology
Technology Trends: Microprocessor Capacity “Graduation Window” Alpha 21264: 15 million Pentium Pro: 5.5 million PowerPC 620: 6.9 million Alpha 21164: 9.3 million Sparc Ultra: 5.2 million Moore’s Law • CMOS improvements: • Die size: 2X every 3 yrs • Line width: halve / 7 yrs
Memory Capacity (Single Chip DRAM) year size(Mb) cyc time 1980 0.0625 250 ns 1983 0.25 220 ns 1986 1 190 ns 1989 4 165 ns 1992 16 145 ns 1996 64 120 ns 2000 256 100 ns
Technology Trends(Summary) Capacity Speed (latency) Logic 2x in 3 years 2x in 3 years DRAM 4x in 3-4 years 2x in 10 years Disk 4x in 2-3 years 2x in 10 years
Processor PerformanceTrends 1000 Supercomputers 100 Mainframes 10 Minicomputers Microprocessors 1 0.1 1965 1970 1975 1980 1985 1990 1995 2000 Year
Performance Trends(Summary) • Workstation performance (measured in Spec Marks) improves roughly 50% per year (2X every 18 months) • Improvement in cost performance estimated at 70% per year
Moore’s Law Paper • Discussion • What did Moore predict? • 35 years later, how did it hold up? • In your view, what was biggest surprise in paper?
Review #3/3: TLB, Virtual Memory • Caches, TLBs, Virtual Memory all understood by examining how they deal with 4 questions: 1) Where can block be placed? 2) How is block found? 3) What block is repalced on miss? 4) How are writes handled? • Page tables map virtual address to physical address • TLBs make virtual memory practical • Locality in data => locality in addresses of data, temporal and spatial • TLB misses are significant in processor performance • funny times, as most systems can’t access all of 2nd level cache without TLB misses! • Today VM allows many processes to share single memory without having to swap all processes to disk; today VM protection is more important than memory hierarchy
Summary • Performance Summary needs good benchmarks and good ways to summarize performance • Transistors/chip for microprocessors growing via “Moore’s Law” 2X 1.5/yrs • Disk capacity (so far) is at a faster rate last 4-5 years • DRAM capacity is at a slower rate last 4-5 years • In general, Bandwidth improving fast, latency improving slowly